


The DAX has risen for seven consecutive weeks and, if it closes above 14.431.86 on Friday, it would have notched up an eight. It’s risen above 20% since the September low which means it is within a technical bull market. Furthermore, implied volatility is trending lower which is constructive of a bullish trend as investors are paying less for downside protection as they’re optimistic for the future. Whilst this all sounds well and good on the face it, it rings alarm bells for the contrarian within me – from both a technical and fundamental perspective.
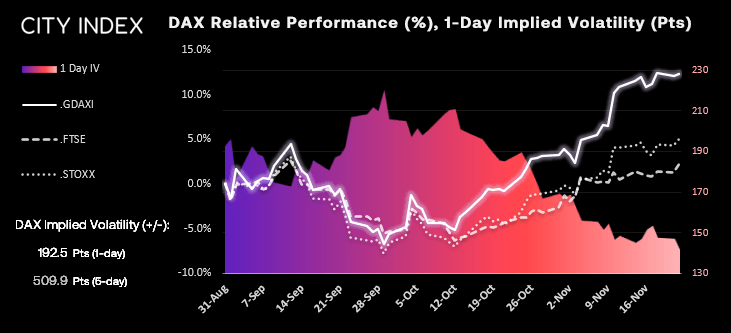
Sure, markets are forward looking and have been pricing in a less aggressive rate of policy tightening. But what if inflation continues to run rampant and this assumption (and therefore higher equity prices) are simply wrong. And when you hear of a market that is bullish across several metrics, there comes a point where mean reversion must kick in as some of the savvier investors unload their book onto the latecomers to the party. This means we could be headed for a retracement at least, or a market opt at the worst.
DAX weekly chart:
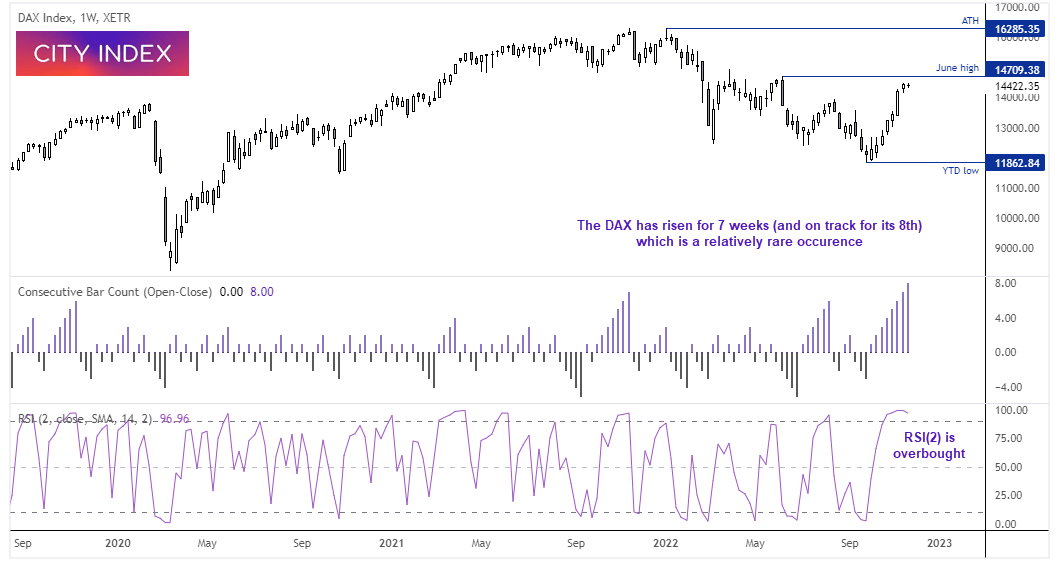
The DAX may be on track for an eight consecutive week, but it is headed straight into a key resistance level around 14,710 (June high). We can see from the top indicator that such a sequence is a rare occurrence, so at the very least we’re likely headed for a single down week if not more soon. RSI (2) has also been overbought for several weeks, so the DAX looks set for some mean reversion, and could tempt countertrend bears whilst prices remain below 14,715.
DAX daily chart:
Prices are consolidating around the highs on the daily chart although struggling to test 14,500. Volumes have also been trending lower over the past couple of weeks as buying activity has dried up. But what’s interesting about these highs is that prices have stalled just below a previous supply zone (June high) which is also near the year-to-date VPOC (volume point of control) – which is the price where the heaviest trading activity has taken place this year. VPOC’s can act as a magnet and draw prices towards them, and provide potential turning points in markets. The question now is whether bulls can extend this rally and break above the June high, or if the market can top out.
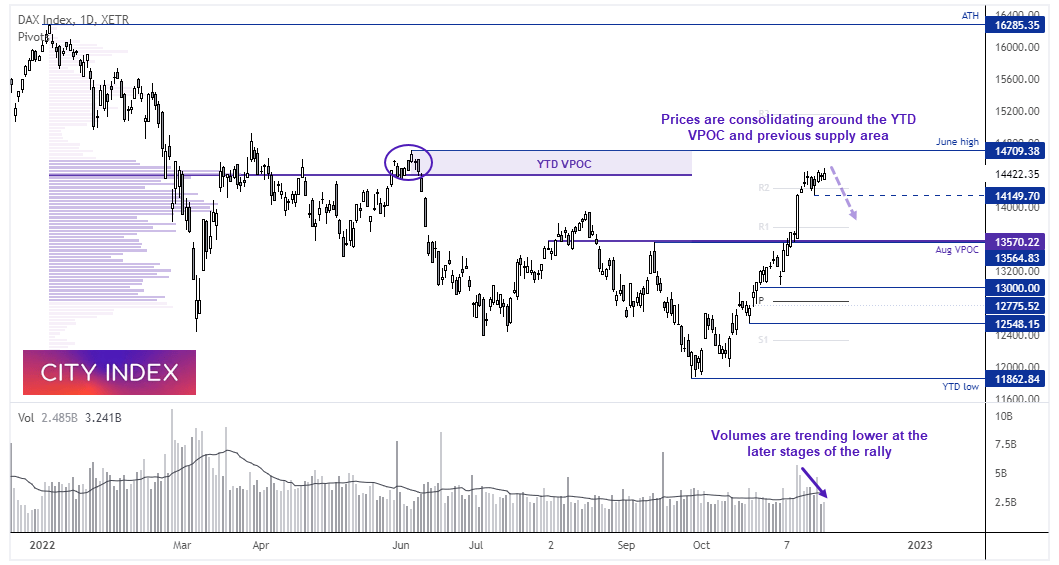
Overall, we have a bearish bias below the June high due to:
- The market has rallied over 20% from its cycle low (a threshold which frequently triggers a retracement)
- Had seven consecutive bullish weeks (a rare bullish sequence which means a down week could be fast approaching
- Prices stalled around the YTD VPOC
- Prices stalled below the June high
- Volumes have been trending lower over the past couple of weeks.
Bears could look to fade into rallies below the June high, or simply assume the top is in and use a wider stop and wait for bearish momentum to return. A more conservative approach is to wait for a break beneath the 14,149 low to assume bearish continuation, with the August VPOC around 13,570 making a potential target.
How to trade with City Index
You can easily trade with City Index by using these four easy steps:
-
Open an account, or log in if you’re already a customer
• Open an account in the UK
• Open an account in Australia
• Open an account in Singapore
- Search for the company you want to trade in our award-winning platform
- Choose your position and size, and your stop and limit levels
- Place the trade
Latest market news
Yesterday 01:32 PM
Yesterday 09:35 AM
Yesterday 07:23 AM
Yesterday 04:48 AM
Yesterday 12:17 AM
July 25, 2024 10:39 PM
Latest Trade Ideas articles

Yesterday 09:35 AM

Yesterday 12:17 AM

July 25, 2024 10:39 PM

July 25, 2024 05:30 PM