


Whilst Wall Street has mostly taken US debt-ceiling concerns within stride, the issue could severely hamper the economy (and therefore sentiment) if the US government defaults on its debt. So we may find that sentiment sours as the week progresses, if heated talks between Democrats and Republicans remain in a deadlock.
Conversely, an excellent buying opportunity could present itself if or when the debt ceiling is inevitably raised once more. And that leaves opportunities for both bulls and bears, depending on how this plays out. So today we look at opportunities for the long or short side on Tesla, Alphabet and Amazon.
Tesla (TSLA) daily chart:
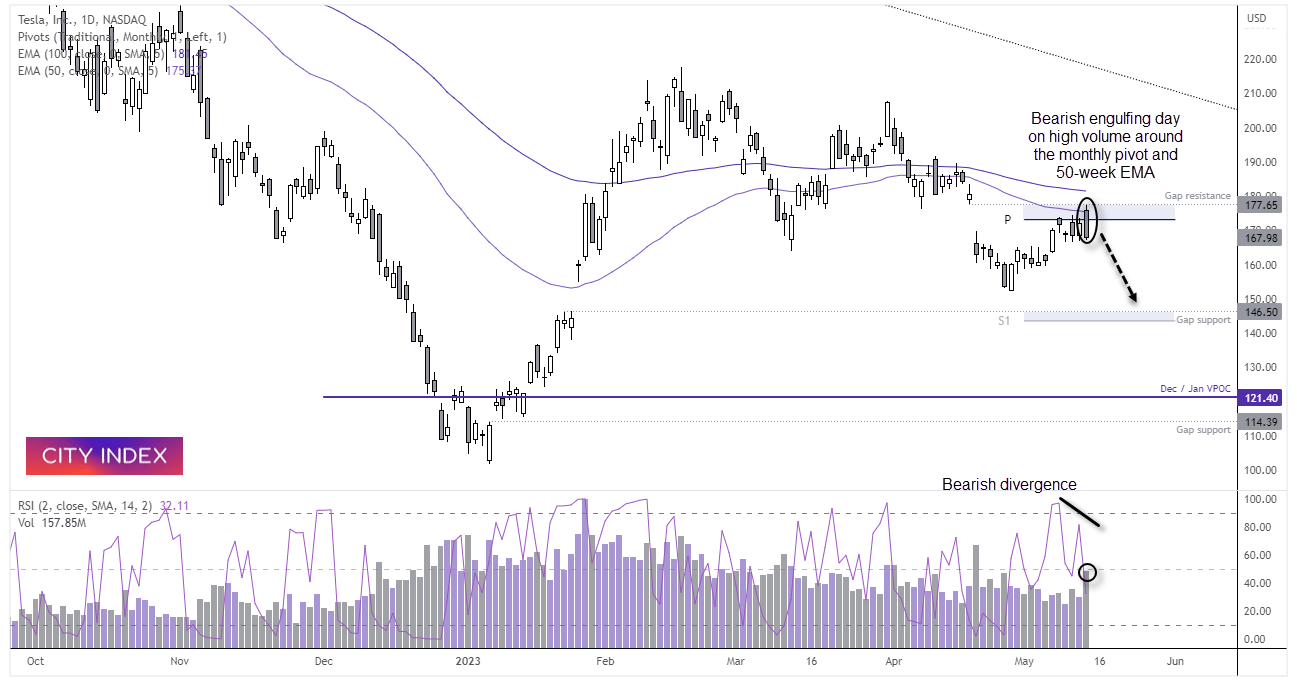
Price action on tesla has been relatively choppy will ill-defined trends on the daily chart. However, several technical factors have come together to provide a potential swing-trade short for bears over the near-term.
The recent rally effectively closed the gap at 177.65, and marked Friday’s high. A bearish engulfing / outside day formed on high volume to suggest a key reversal, and a bearish divergence formed on the RSI (2). Furthermore, the key reversal formed around the monthly pivot point, 50-day EMA and just below the 100-day EMA.
- The bias on the daily chart remains bearish whilst prices remain beneath Friday’s high
- Bears could seek to enter a break of last week’s low, or fade into minor rallies within Friday’s range
- Round numbers such as 160 and 150 make viable downside targets, but if risk-off prices markets it could potentially close the hap at 145.50 around the monthly S1 pivot
Alphabet (GOOG) daily chart:
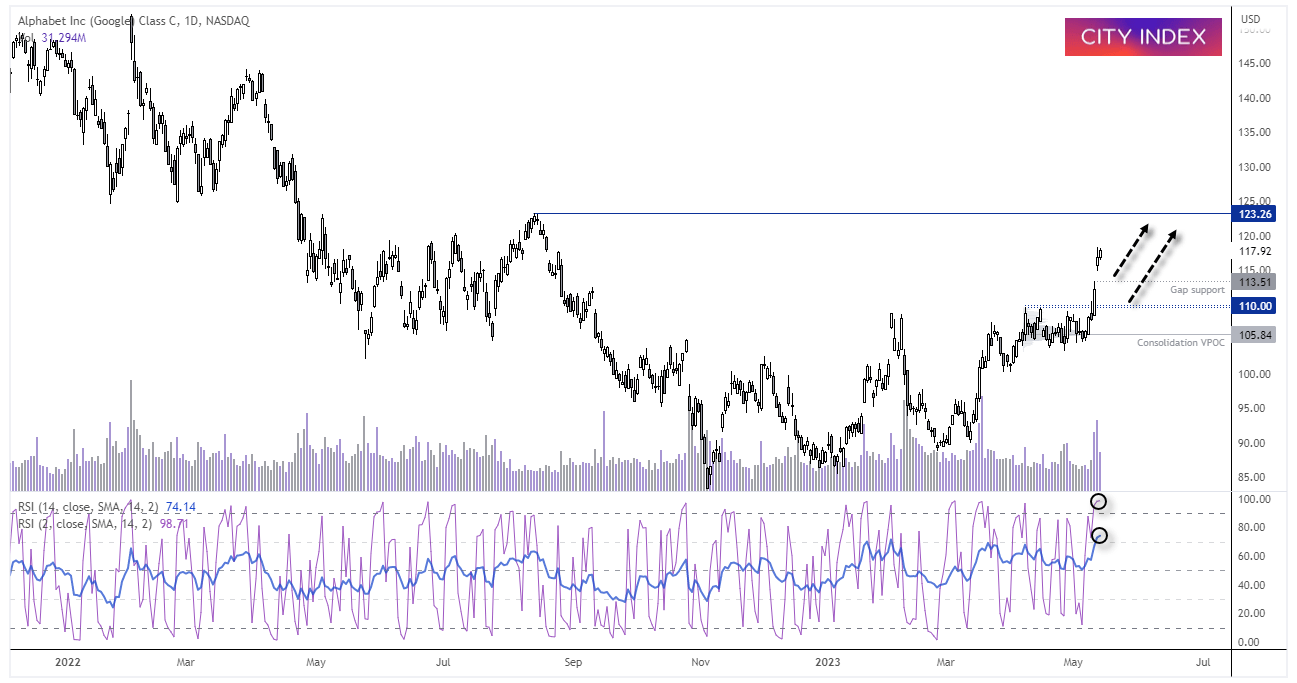
Alphabet posted a strong 11% rally last week, its second time this year to hit double digits. Wall Street clearly liked their announcement last week that AI will be incorporated into Google and helped the stock break convincingly out of a consolidation in the process.
Most of the trading activity within the consolidation took place at 105.84 to suggest this is where institutions were buying ahead of the breakout, and it is a level which could be defended upon any retracement. The rally was also accompanied with strong trading volumes to show initiative buying as prices rose.
However, RSI (2) and (14) have reached overbought levels, so we would prefer to wait for prices to consolidate or retrace against last week’s rally before seeking long opportunities.
- Bulls could seek long opportunities around gap support (113.51) or the highs around 110
- Alternatively, bulls could wait for prices to consolidate further around these highs and seek a bullish breakout on a lower timeframe
- Initial upside targets for bulls to consider include 120 and the 123.23 high
Amazon (AMZN) monthly chart:
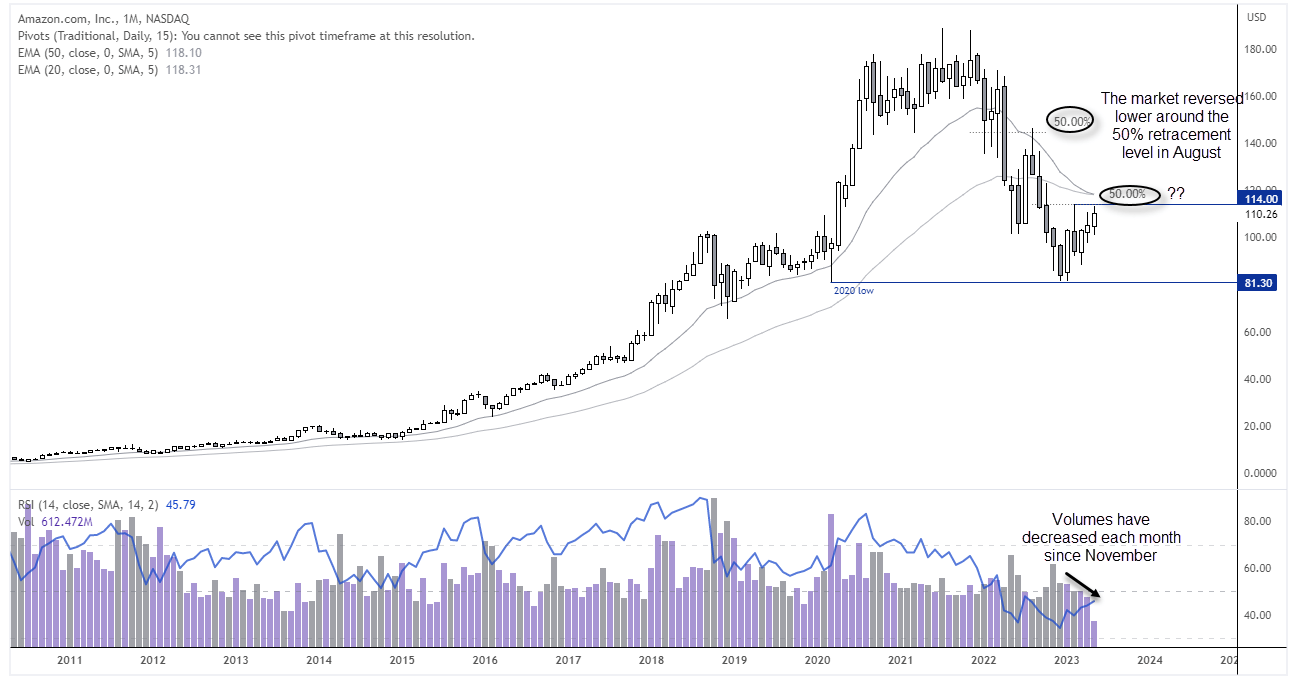
The stock fell -56% from its all-time high to the 2022 low, which is its worst drawdown since the Nasdaq bubble burst. Yet the decline found support just above the 2020 low and formed a bullish outside month to show demand above $80.
We do not yet know whether this is part of a multi-year correction against its multi-year bull trend, but we can see that prices have reached a likely pivot area around, near the February high and 50% retracement level. Notice that the market revered lower around a 50% retracement level back in August 2022, so will history repeat this time around?
We have also noted that monthly trading volumes have diminished each month since the December low to suggest the current rally is losing steam, heading into these highs.
Amazon (AMZN) daily chart:
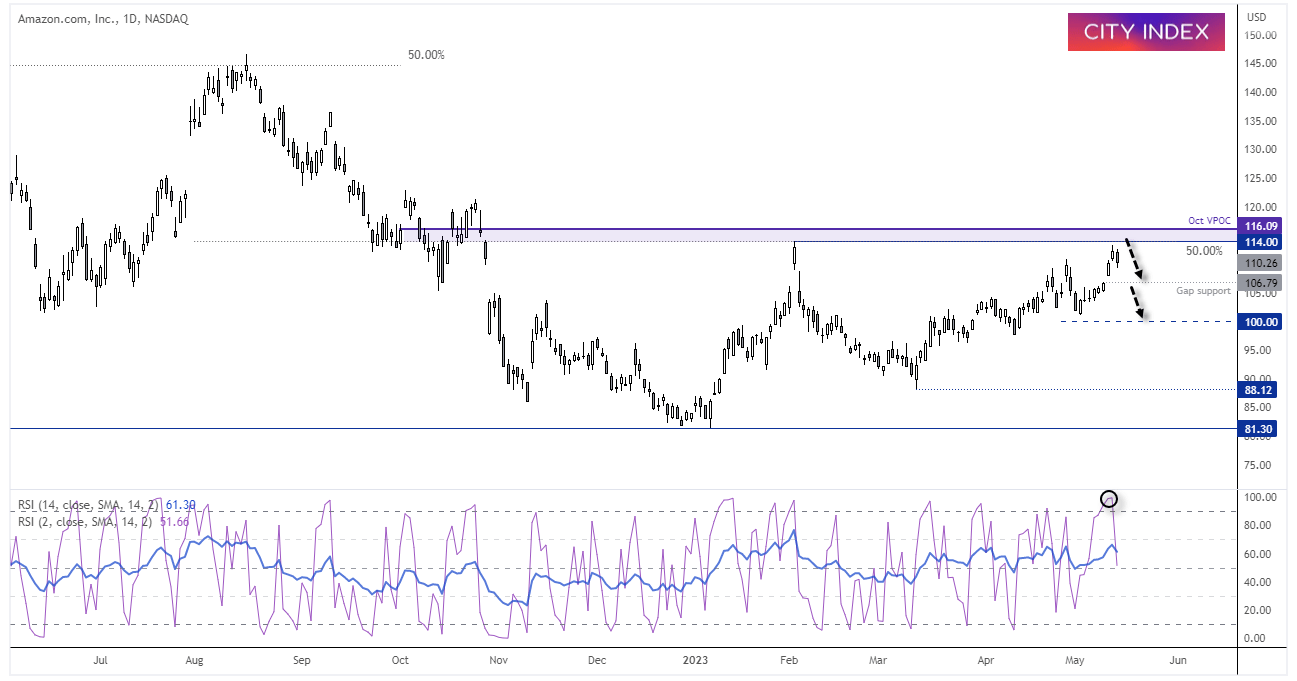
The daily chart shows prices are hesitant to immediately break above the February high, having pulled back on Friday. But we also note that October’s VPOC (volume point of control) is also overhead at $116, and that is a level which may be defended by bears. Over the near-term, we’re looking for prices to close the gap at 106.79, so would consider fading into rallies below $116, a break beneath which brings the lows around $100 into focus. And if that level breaks, we’ll assume it is part of a much larger risk-off move which brings $90 into view.
-- Written by Matt Simpson
Follow Matt on Twitter @cLeverEdge
How to trade with City Index
You can trade with City Index by following these four easy steps:
-
Open an account, or log in if you’re already a customer
• Open an account in the UK
• Open an account in Australia
• Open an account in Singapore
- Search for the market you want to trade in our award-winning platform
- Choose your position and size, and your stop and limit levels
- Place the trade
Latest market news
Yesterday 01:32 PM
Yesterday 09:35 AM
Yesterday 07:23 AM
Yesterday 04:48 AM
Yesterday 12:17 AM
July 25, 2024 10:39 PM
Latest Trade Ideas articles

Yesterday 09:35 AM

Yesterday 12:17 AM

July 25, 2024 10:39 PM

July 25, 2024 05:30 PM