


January 26, 2023 8:47 PM
The South African Reserve Bank (SARB) hiked interest rates by 25bps to bring the key rate to 7.25% at its January meeting. Expectations were for an increase to 50bps. Although the hike was motivated by an increase in inflation, the hike was held to an increase of only 25bps as the bank was concerned about the economic outlook, primarily due to the ever-increasing rolling power cuts (up to 11 hours per day). SARB left its outlook on Core CPI unchanged at 4.3% for 2022, but cut the forecast to 5.3% for 2023 (from 5.5% previously) and to 4.7% in 2024 (from 4.8% previously). In addition, the central bank cut GDP to 0.3% in 2023 (previously 1.1%) and to 0.7% in 2024 (from previously 1.4%). SARB Governor Lesetja Kganyago said that worsening blackouts could reduce growth by as much as 2% this year. Scheduled blackouts, or load shedding, is nothing new in South Africa. Eskom, the state-owned energy company, has failed to upgrade its aging, coal powered, facilities. Load shedding is costing companies millions of dollars.
On a daily timeframe, USD/ZAR has been moving higher since making 2022 lows on March 31st at 14.3997. The pair rose in an upward sloping channel. However, when USD/ZAR bounced off the bottom trendline of the channel on August 15th, 2022, price rose higher within the channel in an ascending wedge formation. The pair made a triple top in October near 18.5790 before breaking below the wedge on November 4th, 2022 and pulled back to the bottom trendline of the longer-term channel near 17.3528. Since then, USD/ZAR has primarily been trading between 17.000 and 17.7000. Currently, price is converging at the 50-Day and 200-Day Moving Averages, as well as the 38.2% Fibonacci retracement level from the March 31st, 2022, low to the October 2022 highs, between 16.9115 and 17.1428.
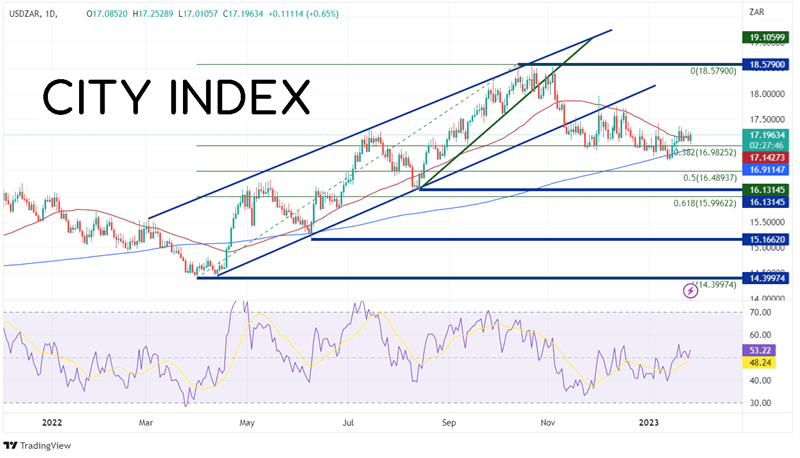
Source: Tradingview, Stone X
Trade USD/ZAR now: Login or Open a new account!
• Open an account in the UK
• Open an account in Australia
• Open an account in Singapore
On a 240-minute timeframe, USD/ZAR has formed a flag formation off the recent lows. After the SARB dovish rate hike, the pair bounced off the bottom trendline of the flag and the 50% retracement from the lows of January 12th to the highs of January 19th, near 17.0323. If price breaks above the flag, the first resistance level is the highs of January 19th at 17.3747. Above there, price can move to horizontal resistance at 17.5025, then the flag target at 17.6837. However, if the top trendline of the flag pattern holds, first support is at the 50-Day Moving Average of 17.1427 (see daily). Below there, price can fall to Thursday’s low at 17.0323, then the 61.8% Fibonacci retracement level from the above mentioned timeframe at 16.9515.
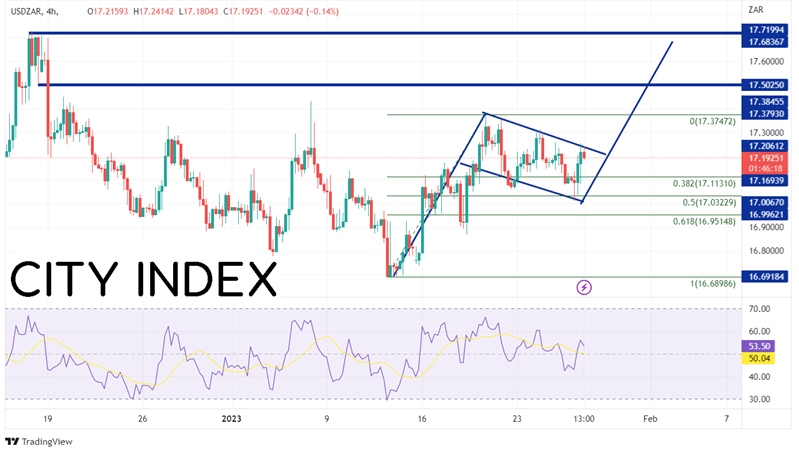
Source: Tradingview, Stone X
The South African Reserve Bank hiked interest rates by 25bps. By the sound of things, it appears they could have gone with 50bps, but held back due to ongoing load shedding and the hit it may take on the economy. As a result of the dovish hike, USD/ZAR has moved higher to the top trendline of a flag formation on the 240-minute timeframe. If the pair breaks the top of the flag formation, it could be on its way to the target near 17.6837.
Learn more about forex trading opportunities.
Latest market news
Yesterday 01:32 PM
Yesterday 09:35 AM
Yesterday 07:23 AM
Yesterday 04:48 AM
Yesterday 12:17 AM
July 25, 2024 10:39 PM
Latest Trade Ideas articles

Yesterday 09:35 AM

Yesterday 12:17 AM

July 25, 2024 10:39 PM

July 25, 2024 05:30 PM