


June 23, 2022 4:34 PM
Norway’s Norges Bank surprised markets earlier by hiking rates 50bps from 0.75% to 1.25%. Expectations were only for a rate hike of 25bps. The Committee was primarily concerned with the risk of inflation moving higher than anticipated against the background of little spare capacity in the Norwegian economy. Norway’s CPI for May was 5.7% YoY vs 5.4% YoY in April. This was the highest level since December 1988. The central bank also increased their forecast for interest rates for 2023, from 2.5% at the end of next year to 3% in the middle of next year, while Norges Bank Governor Ida Wolden Bache said she is willing to raise rates by 50bps if needed. The Committee cut its GDP forecast as well, lowering this year’s forecast to 3.5% from 4.1% in March and the 2023 forecast to 1.1% vs 1.6% previously.
Trade USD/NOK now: Login or Open a new account!
• Open an account in the UK
• Open an account in Australia
• Open an account in Singapore
During the beginning of the Coronavirus pandemic in March 2020, USD/NOK rose from 9.2412 to a high of 12.1224! The pair then pulled back and made a low of 8.1477 during the week of April 26th, 2021. USD/NOK has slowly been grinding higher since then. With increasing expectations of higher interest rates from the Fed, the pair started moving aggressively higher in April of this year, forming a flag pattern which targets near 10.5225 on the weekly timeframe. However, the move out of the flag pattern has stalled at the 50% retracement level from the March 2020 highs to the April 26th, 2021 lows, near 10.1351.
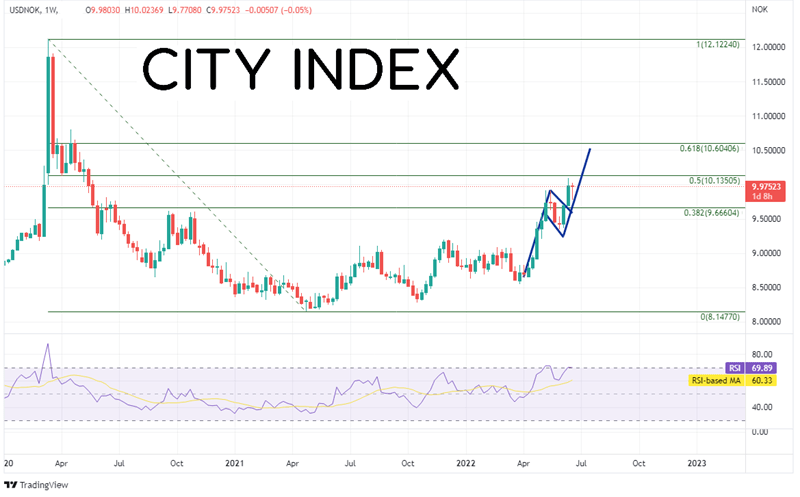
Source: Tradingview, Stone X
On a daily timeframe, the price of USD/NOK has made a flag pattern of its own. The target of for the flag pattern on the shorter timeframe is similar to that of the pattern on the weekly timeframe. However, if USD/NOK is to reach target, it must first pass through horizontal resistance and the previously mentioned 50% retracement level on the weekly timeframe near 10.1243/10.1351. Above there, the next resistance level isn’t until the 61.8% Fibonacci retracement from the March 2020 highs to the April 26th, 2021 lows at 10.6041. If the flag pattern fails and price moves lower, first support is at the lows of June 21st at 9.7708. Below there USD/NOK can fall to the lows of June 1st at 9.3441 and then additional horizontal support dating back to December 2021 near 9.1941.
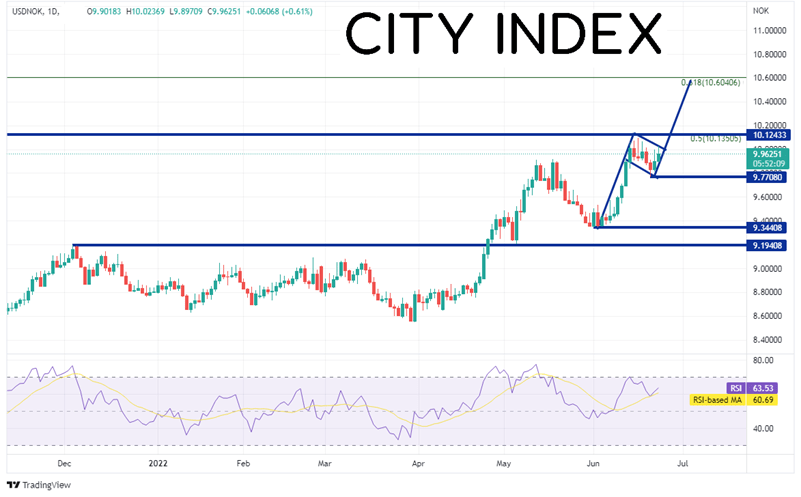
Source: Tradingview, Stone X
The Norges Bank is the latest bank surprise markets with a 50bps rate hike. Concerns of a rising inflation with a tight labor market were the reasons for the greater magnitude in the hike. They are expected to raise rates by 25bps in August. Could the central bank surprise and hike 50bps again?
Learn more about forex trading opportunities.
Latest market news
Yesterday 01:32 PM
Yesterday 09:35 AM
Yesterday 07:23 AM
Yesterday 04:48 AM
Yesterday 12:17 AM
July 25, 2024 10:39 PM
Latest Trade Ideas articles

Yesterday 09:35 AM

Yesterday 12:17 AM

July 25, 2024 10:39 PM

July 25, 2024 05:30 PM