


It’s that time of year that we’re reminded of the old adage to “sell in May and go away”. It is based on the historical observation that stock markets tend to underperform between May and September. Yet a cursory glance at historical performance shows that is it not that straight forward.
- Wall Street indices (S&P 500 and Nasdaq 100) tend to rise between May to September
- European indices (FTSE, STOXX, DAX) and APAC indices (Nikkei, Hang Seng, CSI 300 and ASX 200) tend to decline between May to September
- Returns in May are skewed to the upside in May, with the Nasdaq and S&P 500 outperforming, the ASX is the only average negative return, the rest are mostly flat
- April, July and Q4 tend to be bullish months for all indices
- The selling seems to begin in August and September, not May as implied

If you have been following price action you may have already noticed that stock markets have not been following their seasonal patterns this month. Whilst April has averaged strong positive returns for all indices in the dashboard, they’re on track for their first bearish month in five.
And that highlights why we need to use seasonality with large doses of salt, because ultimately incoming data, headlines and themes will guide prices – not seasonality itself. And that is because the dashboard merely shows an average of historical returns.
The fact that average returns are generally mediocre in May and June for most indices tells us that there’s not really a seasonal pattern at play. And that fact that indices didn’t deliver strong returns in April like their average returns suggest that they could also shows that outlier months can skew the results.
S&P 500, Nasdaq, Dow Jones to snap 5-month winning streaks
It would appear “sell in May”’ arrive a month early, given Wall Street indices are poised to close lower for the first month in six. In hindsight, the fact they rose for five straight months into record highs should have served as a warning of the impending pullback. Especially since indices have not delivered five straight months of gains since August 2020 – after governments pumped unprecedented levels of liquidity into the financial system.
Asset managers remain net long al three futures contracts, although the Dow Jones is on the cusp of flipping to net-short exposure. We saw positioning dip into short territory in 2022 and 2023 for a few months, yet it marked a period of underperformance relative to the Nasdaq and S&P 500 as opposed to significant losses.
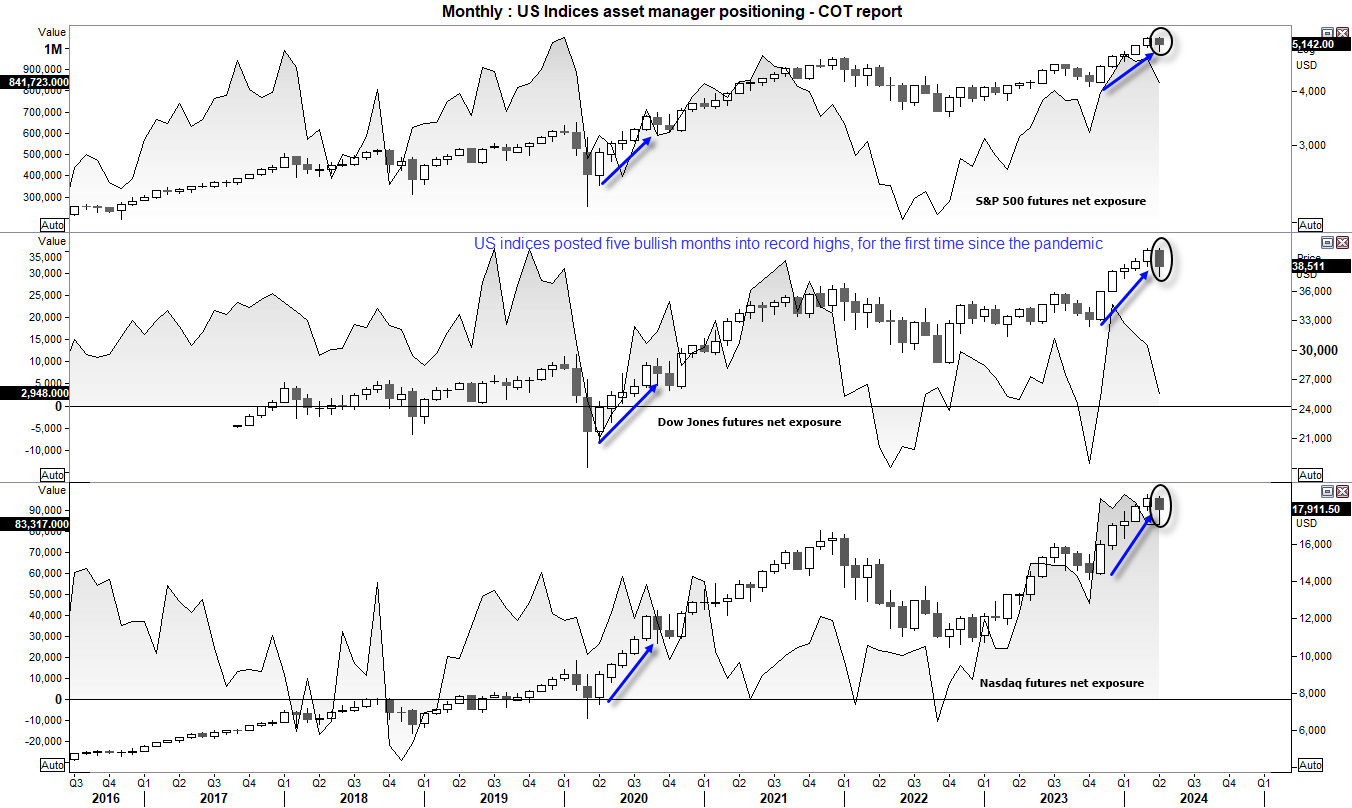
Ultimately, whilst a case could be made for a deeper pullback, asset managers do not seem ready to throw in the towel on a bullish stock market despite the prospects of high-for-longer Fed rates. So even if ‘sell in May’ plays out through to September, the forward-looking stock market may try to break to new highs once more. Unless the wheels fall off of the US economy.

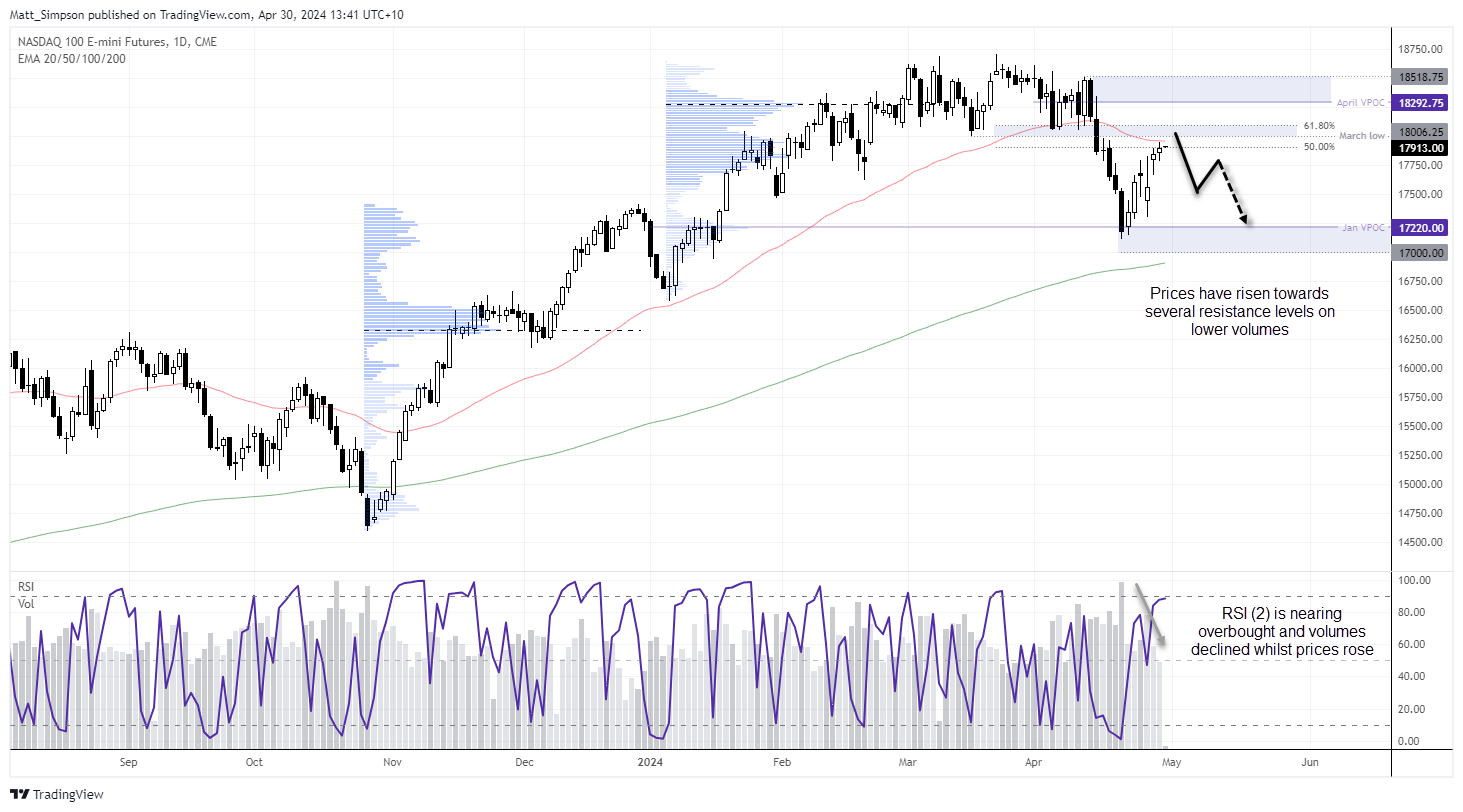
Nasdaq 100 futures technical analysis:
With that said, I am now wondering if US indices are due a pullback lower, given their late month rebounds have stalled around resistance levels. The Nasdaq 100 futures chart shows that prices remain trapped between the 200-day and 50-day EMAs.
The initial decline from the March high held above 17k, and the choppy nature of the ‘rebound’ from the 17k area suggests it is a retracement against the move lower from the 18,518. And that suggests another cycle low could be on the horizon.
Also note that the RSI (2) is very close to overbought, and volume have diminished whilst prices have risen to suggest a lack of bullish enthusiasm for the move. Therefore, the bias is for the Nasdaq to top out this week. Bears can seek to fade into move around the 18,000 – 18,100 area with a stop above 18,250. The initial target is around 17,500.
-- Written by Matt Simpson
Follow Matt on Twitter @cLeverEdge
How to trade with City Index
You can trade with City Index by following these four easy steps:
-
Open an account, or log in if you’re already a customer
• Open an account in the UK
• Open an account in Australia
• Open an account in Singapore
- Search for the market you want to trade in our award-winning platform
- Choose your position and size, and your stop and limit levels
- Place the trade
Latest market news
Today 03:00 PM
Today 02:12 PM
Today 01:23 PM
Today 12:15 PM
Latest Trade Ideas articles

Today 03:00 PM

Today 12:15 PM


Yesterday 10:58 PM