


Q2 2024 Equities Forecast: SPX, Nasdaq and Dow
Equity Forecast for Q2, 2024 – Talking Points:
- It was a strong Q1 for stocks and as looked at in the 2024 Forecast, a dovish FOMC helped to drive continuation in bullish trends that re-started in Q4 of 2023.
- The Fed has seemingly shrugged off inflation prints indicating possible entrenchment while focusing on Core PCE which has continued to fall. Even with strength remaining in the labor market, the Fed appears ready to cut later this year and that dovish enthusiasm can continue to drive equities, although it may not be in an almost linear fashion such as we’ve seen over the past five months.
Stocks Continue Drive to Higher-Highs
In the 2024 Forecast for equities, I looked at bullish continuation scenarios for US indices. That argument was largely driven by a combination of the trend that had started in Q4 of last year, along with the major driver behind it with a dovish FOMC priming the market for rate cuts to begin at some point in 2024. In Q1 of this year, so far, we’ve seen that dovishness continue as FOMC members have seemingly shrugged off positive data that suggests that they should wait to cut, while focusing on less-positive data that may indicate a softening backdrop.
This sets the stage for more strength in Q2, although there is risk of a pullback given how quickly and aggressively those trends in stocks have priced-in. The bigger question is whether a pullback could turn into anything more and with a crowded trade that’s run for an extended length of time, corresponding pullbacks can also be sizable. But, given what we’ve heard from the Federal Reserve so far this year it certainly appears as though they’re handling the rates situation with extreme caution, and I’m of the belief that we’ll see bullish trends in stocks continue through Q2. And if a pullback does show, I’m of the mind that it’ll be corrective and possibly brief as a combination of Fed-dovishness and market excitement ahead of the election in November could allow for big-picture strength to remain.
The Fed and Impact on Stocks
The sticking point remains inflation, but we saw the Fed’s communication at work on this theme in the middle of Q1. As of this writing, Core CPI looks very sticky, and may be showing that ‘entrenchment’ fear that the Fed had mentioned as a risk when slowing down rate hikes. There’s now been six consecutive months of Core CPI sticking within a 0.3% band of the 4% mark, which is double the Fed’s 2% target. So, from an inflation-front, looking at that data point, the Fed should be looking at hikes – not cuts.
On the employment front, the U.S. labor market continues to show strength. The unemployment rate has been below 4% for more than two full years now – and that’s the longest such streak since the Vietnam war. This is similarly something that would not indicate that rate cuts should be on the horizon.
When the Core CPI data point was released in February it caused a bit of commotion: Stocks pulled back, the U.S. Dollar ran up to resistance at the 105.00 handle on DXY and Gold put in its first test below the $2k psychological level in 2024. But – the move was brief. The morning after that release, Chicago Fed President, Austan Goolsbee, commented that market participants should avoid getting ‘flipped out’ about the inflation release. That comment had a fast impact on markets as the Dollar began to drop, gold started to rally, and equities came back to life.
This, again, illustrates what I had discussed in the 2024 Forecast: The Fed seems so incredibly dovish that it’ll likely take a lot of force to move them away from their expectation for rate cuts this year. They’ve shown a tendency to focus in on data highlighting what they want while ignoring data that doesn’t, and this would seem to be a similar trap that the bank had fallen into during the ‘transitory’ fiasco that led to the build of inflation in the first place.
On the Fed’s side of the dovish argument, there has been more progress on inflation via another data point. Core PCE is often considered to be the Fed’s ‘preferred inflation gauge’ and that’s continued to draw down while getting closer to the 2% marker. However, we’re still not there and given the stall in Core CPI over the past six months, it would seem reasonable to attain some balance on the matter. But, as we heard at the March FOMC rate decision that is not the case, as the Fed appears very ready to begin cutting rates as soon as they believe the backdrop will allow.
Core CPI (blue) v/s Core PCE (orange)
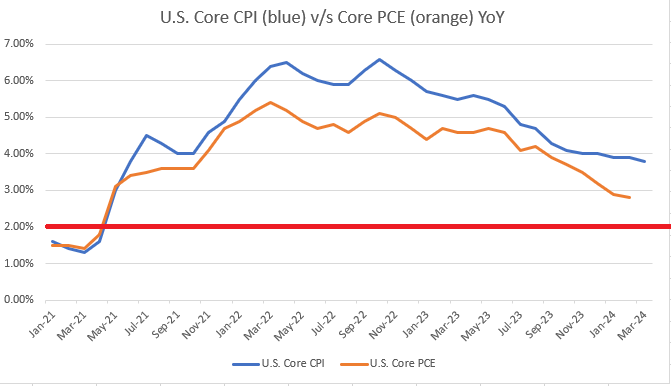
Chart prepared by James Stanley
Pullback Potential
Crowded trades can become prone to pullbacks and we saw a very brief, short-term illustration of this in Q1 on the back of that CPI print released in mid-February. That was enough to give bulls reason to pause, and in markets, when profit motive is at play, that pause in a strong bullish trend can quickly lead to pullback, particularly in a crowded scenario.
The bigger question after the pullback is ‘what’s next,’ as sellers then have the prospect of selling whilst near support in a previously strong bullish trend. Meanwhile, bulls have a chance to buy at a lower price, near support, where risk can be managed more-efficiently as opposed to chasing at fresh highs. If there’s also some dovish Fed commentary to add into the mix, well, that could give bulls even more motivation to bid support, thereby leading to continuation in those trends.
The challenge is that as the trade gets more and more crowded, there’s less money on the sidelines to continue chasing fresh highs. This type of behavior often leads to the build of wedge formations as buying activity is aggressive on lows or tests of support, while less so at higher or tests of resistance. That’s precisely what’s built in the S&P 500 over the past five months and this formation is often tracked with aim of bearish reversal. But, as I had noted earlier, I think that pullbacks or bearish breakouts from the formation can be offset by dovish Fed-speak, such as we saw in mid-February after the CPI release.
S&P 500 Daily Price Chart
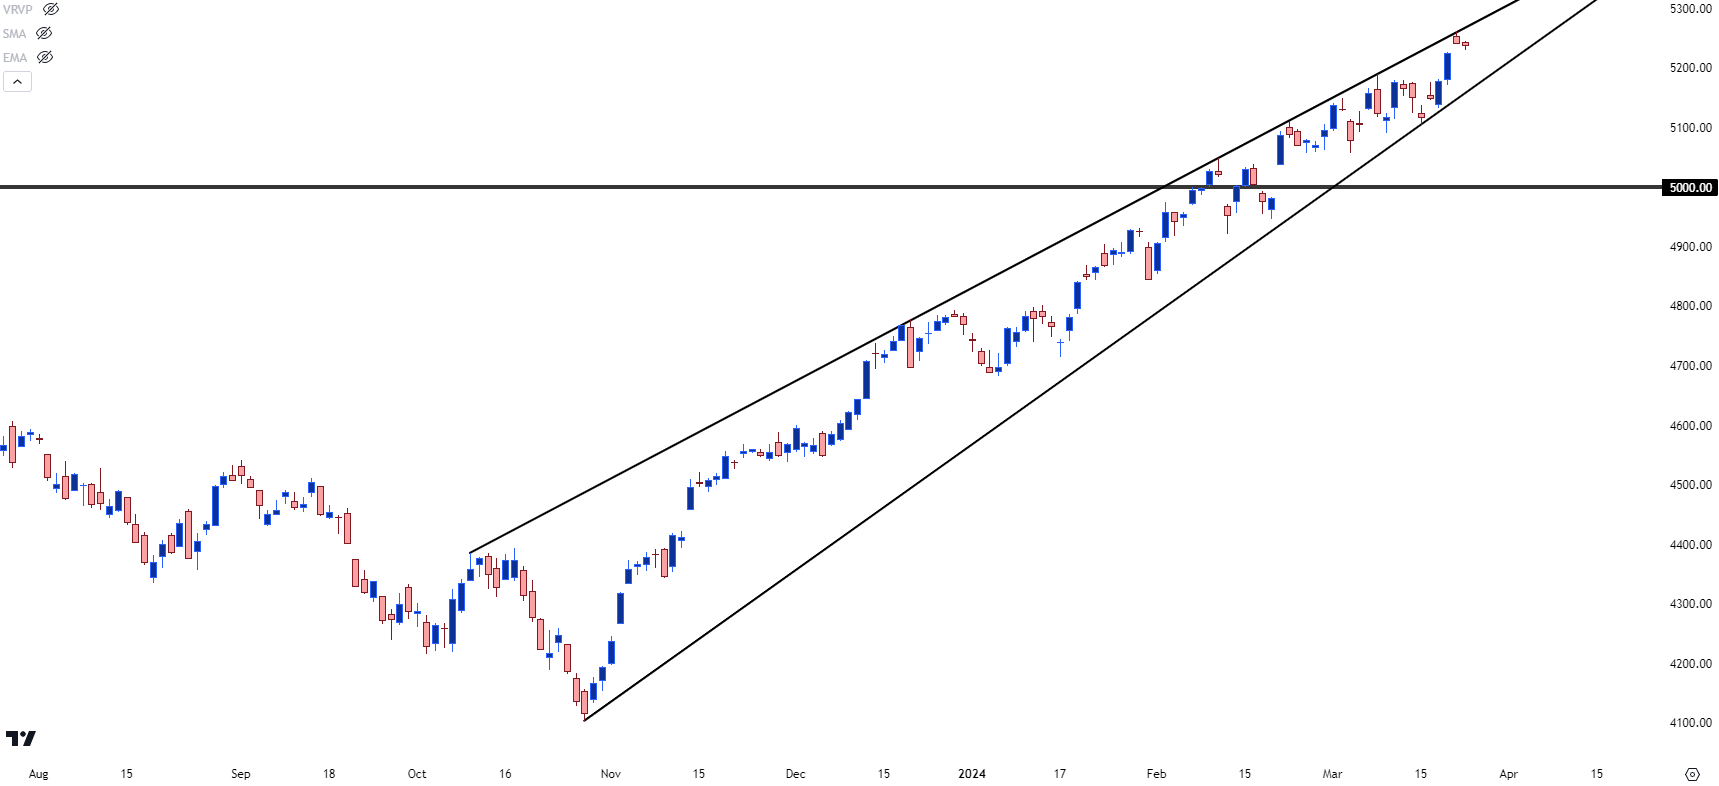
Chart prepared by James Stanley; data derived from Tradingview
SPX for Q2, 2024 – 5,500
In the S&P 500 price remains very near the all-time-high, so there’s a lack of reference for the chart’s current real estate. Psychological levels, however, can be helpful and this highlights the 5,500 level as an area of interest, with 5300 and 5400 of interest to a lesser degree. The 5,500 level would be just about 5% away (4.85% as of this writing) and that seems a reasonable expectation for bullish continuation given the pace of the trend so far.
But, again, I think we’re around a possible pullback scenario and depending when that shows, and how, those resistance targets could become more of a challenge depending on how deep the pullback runs.
For possible support, I’m tracking nearby levels at 5,111, 5,058 and then the 5k psychological level. A pullback to and hold of support at either of those three spots keeps the door open for bulls to continue the trend. A bit deeper is the 4842 level and if that’s tested, we would be looking at a more than 7% pullback from current levels which would suggest change in the backdrop. At that point, 5k could, potentially, come back as a lower-high resistance level and if that takes place there could be a trend reversal in the mix with a follow-through support target at the 4,607 level.
S&P 500 Weekly Price Chart
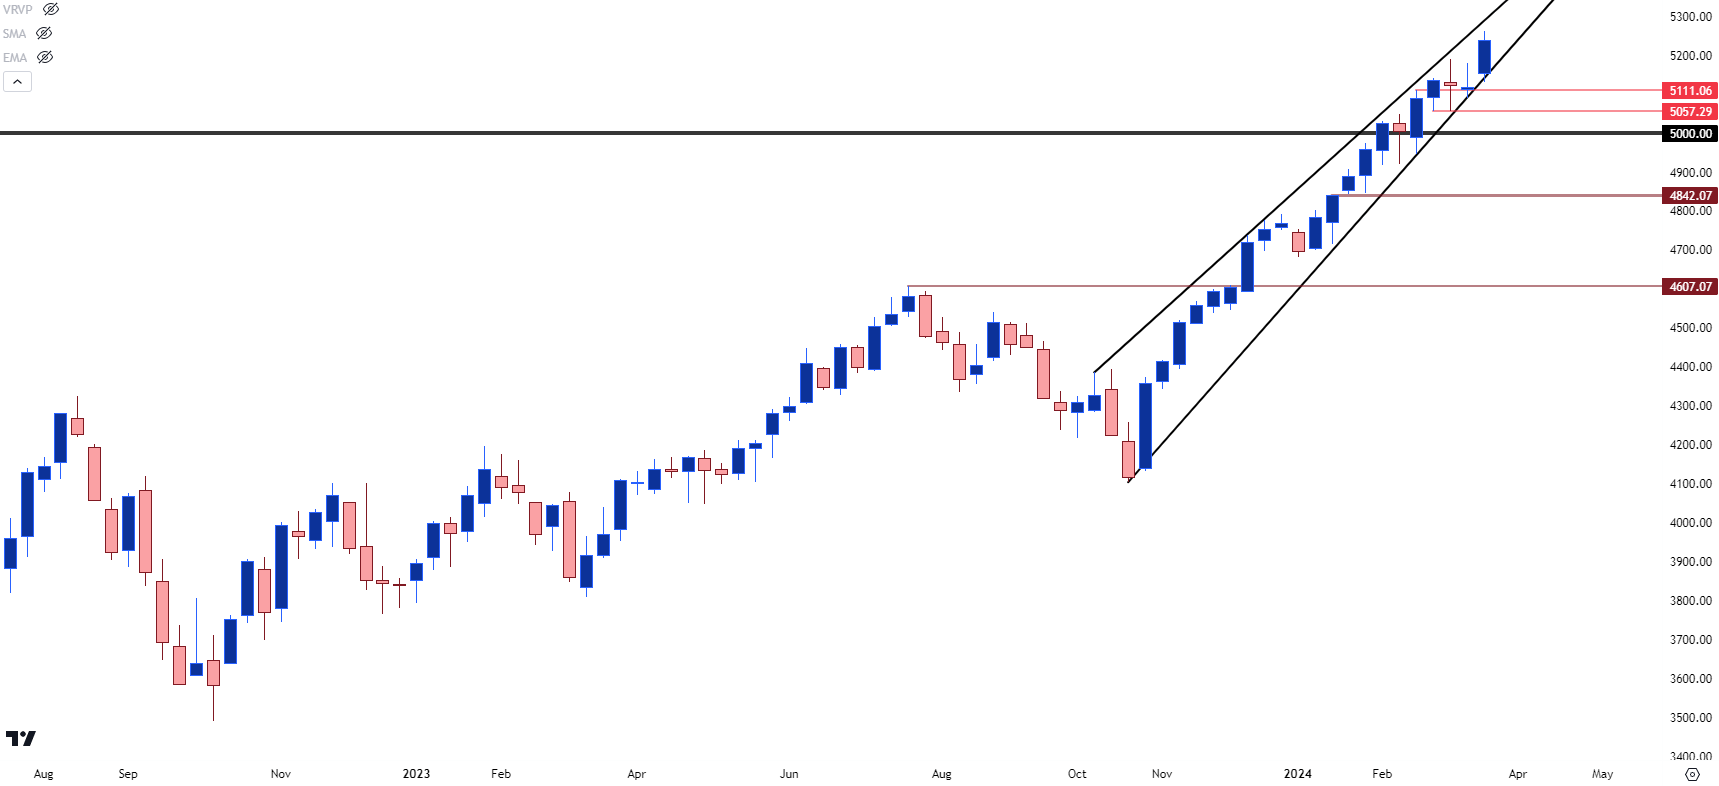
Chart prepared by James Stanley; data derived from Tradingview
Nasdaq 100
The 18,500 level that I looked at as the second resistance target in the prior forecast has proven to be a strong zone. As of this writing, bulls are still going to work on the resistance produced by the 127.2% extension of the 2022 sell-off that’s just inside of 18,500; and there’s been an element of stall showing, which complicates continuation scenarios. But – on the other side of that, so far, the 18k level of prior resistance has been gaining greater acceptance from bulls after previously showing as resistance in February.
If there is a pullback in Q2, however, the Nasdaq could be more vulnerable given the constituency of the index. The AI theme has been handsomely-priced, and this points to the crowded trade phenomenon mentioned earlier, where an aggressive bullish trend could be prone to wider pullback or retracement scenarios. I’m tracking possible supports in the Nasdaq at 17,314 and 16,969, the latter of which is confluent with the 17k psychological level.
Above current price, I’m looking at possible resistance at psychological levels of 19k, 19,500 and then 20k. I will retain the 20,673 level as a longer-term resistance level, which has some relation to 18,500. As I had mentioned in the prior forecast, it was around the 18,500 level that the 127.2% extension plotted, and the 161.8% extension of that same Fibonacci study plots at 20,673.
Nasdaq 100 Weekly Price Chart
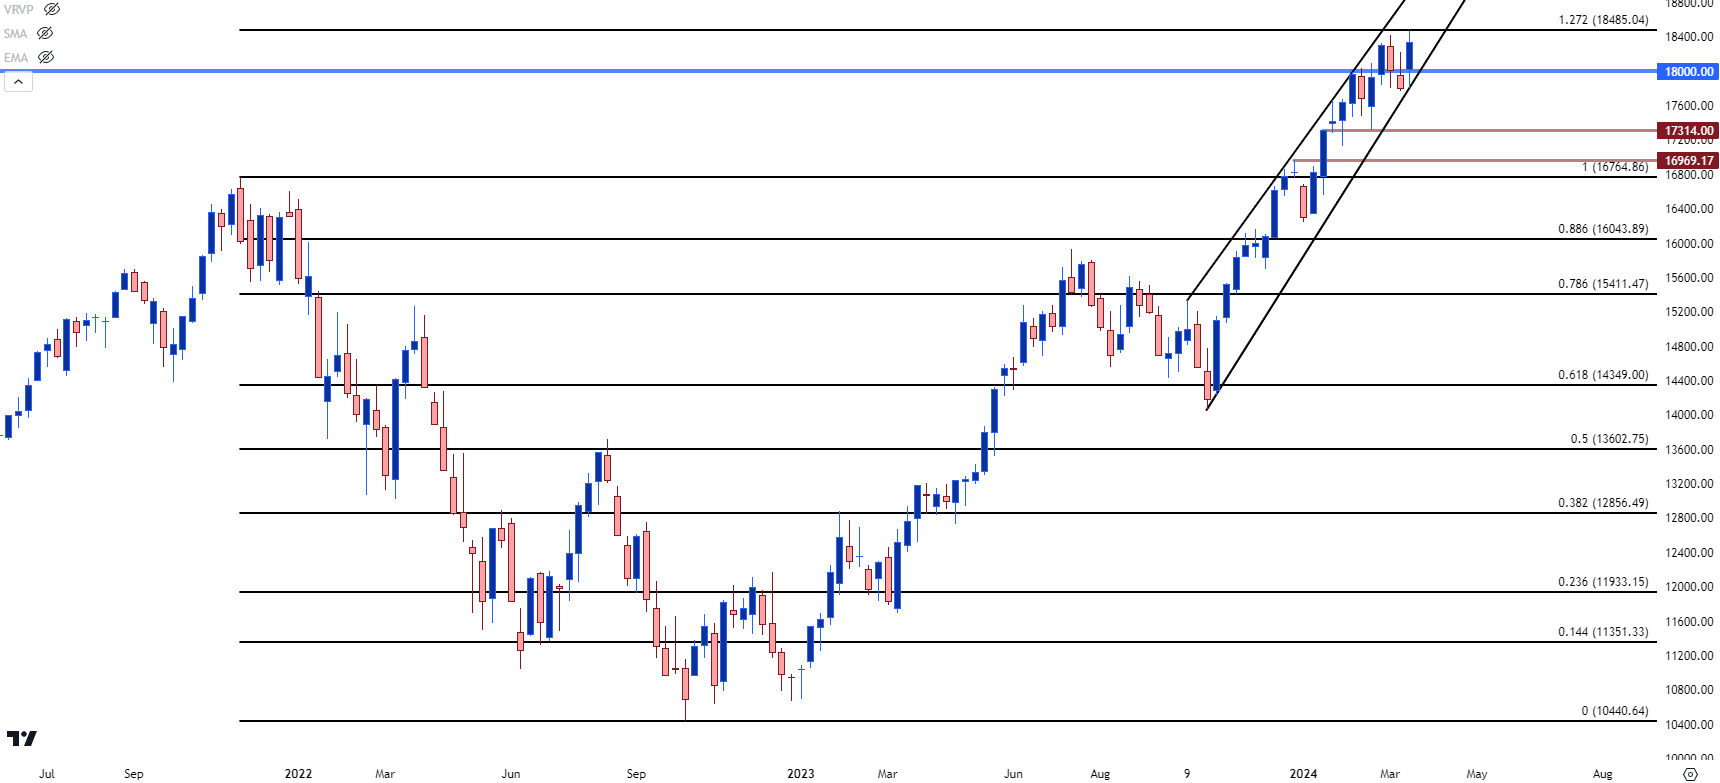
Chart prepared by James Stanley; data derived from Tradingview
Dow Jones
My prior forecast focused on the 40k level on the Dow, which remains 100 points away from the current high, although that may still be met by the end of Q1 trade. But I think that could remain as a stumbling block if it does trade, as a psychological level of that nature tends to produce reverberations in near-term price flow on the initial test, especially given the extended length of the bullish trend. In any elongated bullish rally, there will be an element of over-crowding and once a new, significant psychological level trades, that market can begin to feel more ‘expensive,’ leading to profit taking.
Above the 40k level, the 200% extension of the pandemic sell-off plots just below 41k at 40,923, and that’s what I’ll identify as a follow-through resistance target.
For support, the trend in Q1 grinded-higher for much of the period so there’s not much for recent reference to work from. I’m highlighting 38,927 as a nearby spot of possible support and a show from bulls there retains an aggressive look for the trend; but if price can extend that pullback, the same resistance that had set towards the end of 2023 trade at 37,778 becomes of interest for support potential.
Dow Jones Weekly Price Chart
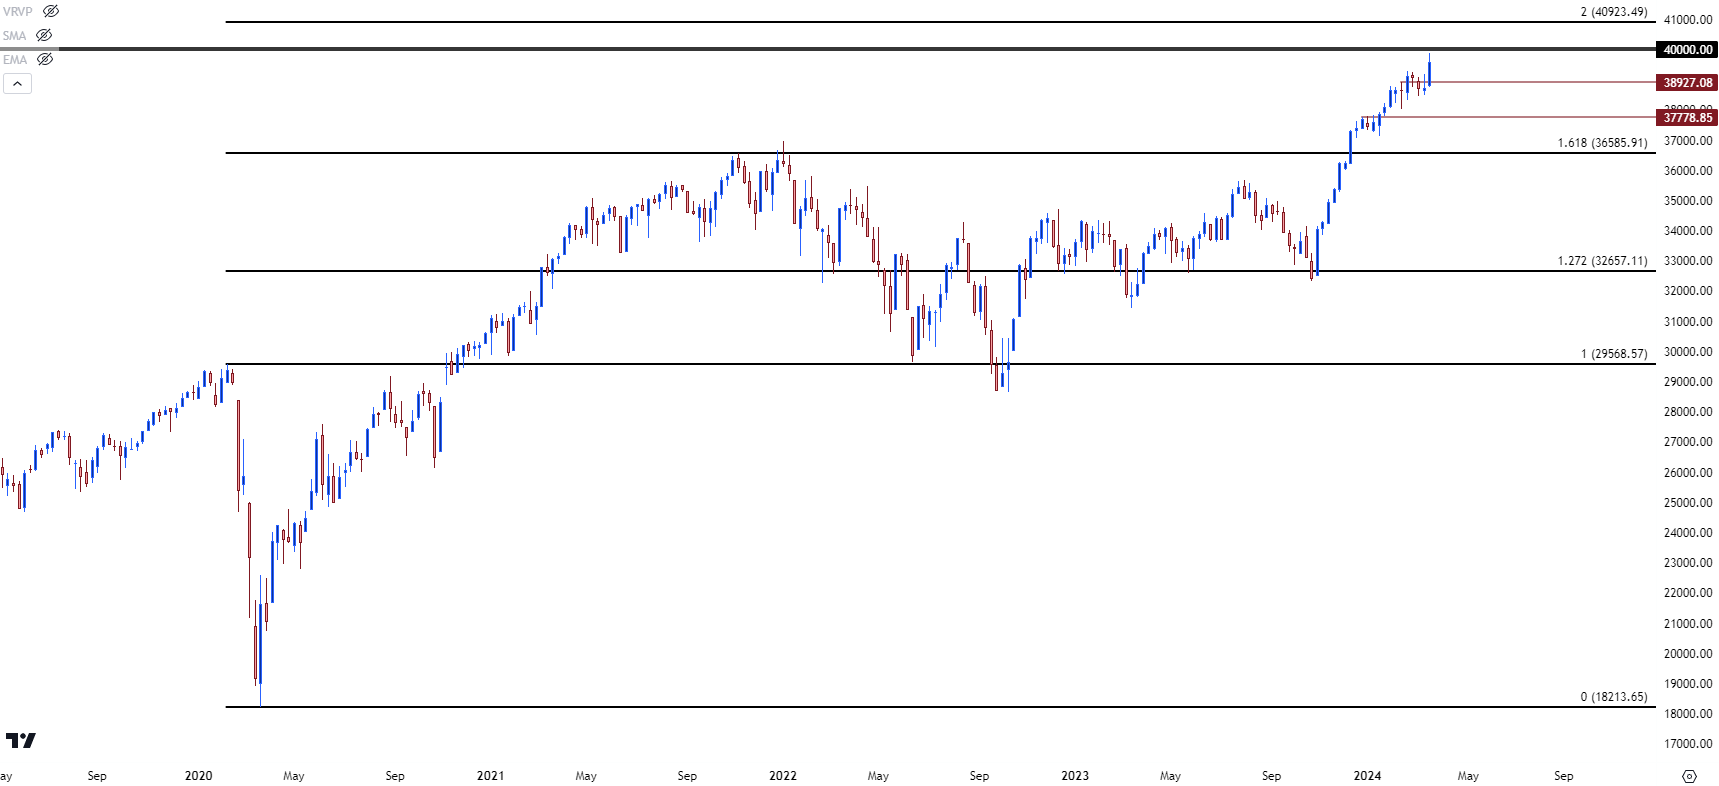
Chart prepared by James Stanley; data derived from Tradingview
--- written by James Stanley, Senior Strategist