


July 13, 2022 8:35 PM

Most of the big-name tech companies are due to report earnings over the next few weeks, including such names as Netflix, Amazon, and Apple. Although some company’s earnings will come in worse than Q1, it is the forward guidance that needs to be paid attention to. However, are the markets beginning to price in higher stock prices for larger tech companies in the NASDAQ 100 compared to smaller companies in the Russell 2000?
The NASDAQ 100 made an all-time high on November 22nd, 2021 at 16764.86 while forming a diamond reversal formation. Since then, the tech index has been moving lower. As of the end of February, the NASDAQ 100 continued to fall in a descending wedge formation. The expectation is that prices will breakout higher from a descending pattern. On June 16th, the index made a near-term low at 11037.21. However, on July 7th, the index broke higher out of the top of the wedge. Today, price came back to test the upper trendline of the wedge and may close above it, a sign that prices may not be ready to continue lower.
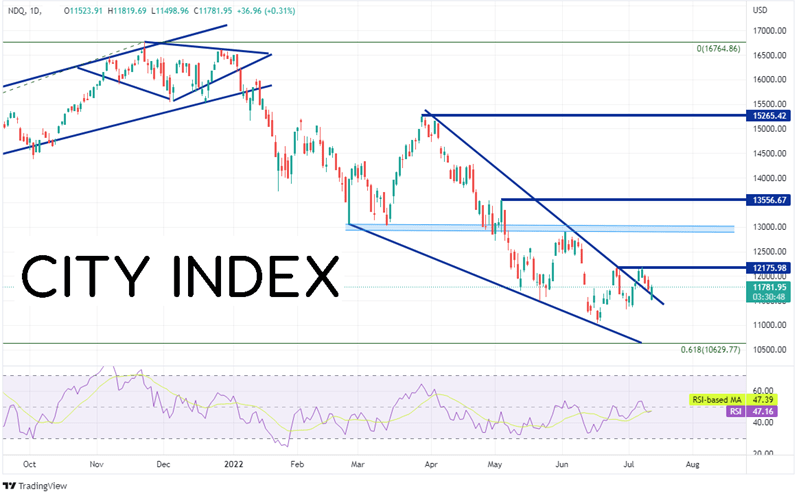
Source: Tradingview, Stone X
Trade the NASDAQ 100 now: Login or Open a new account!
• Open an account in the UK
• Open an account in Australia
• Open an account in Singapore
The Russell 2000 made an all-time high on November 8th, 2021, just before the NASDAQ 100. Price began moving lower in an AB=CD formation. As of the end of February, the Russell 2000 continued to move lower in a descending wedge formation. However, unlike the NASDAQ 100, the Russell 2000 has yet to break out of the pattern. The small cap index made a near-term low on June 16th and bounced. However, price could not break above the top trendline of the pattern.
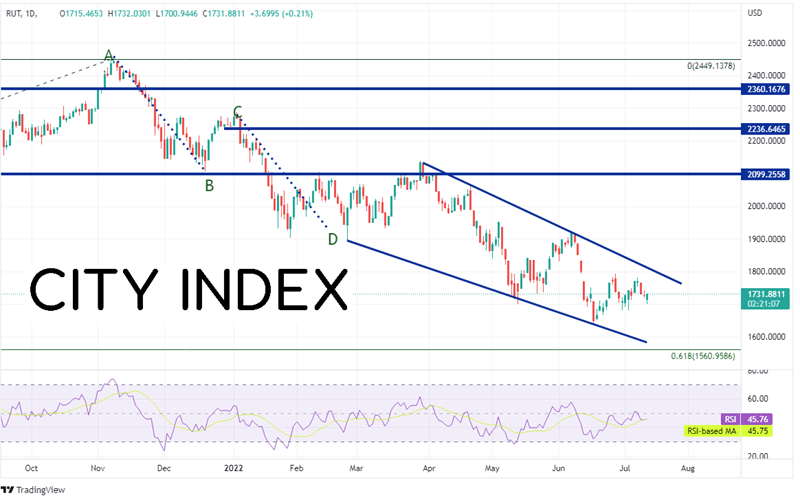
Source: Tradingview, Stone X
Trade Russell 2000 now: Login or Open a new account!
• Open an account in the UK
• Open an account in Australia
• Open an account in Singapore
The NASDAQ 100/Russell 2000 tells us which of the two indices is performing better. When the ratio is moving higher, the NASDAQ 100 in outperforming. When the ratio is moving lower, the Russell 2000 is outperforming. The ratio made an all-time high on February 3rd, 2022 at 7.44 (just a one tick above the December 2021 highs of 7.43). Since then, the ratio has been trending lower. In early April 2022, the ratio continued moving lower in a descending wedge formation (as you may have guessed). As with the NASDAQ 100, the ratio broke above the top trendline of the formation (on June 16th), as hasn’t pulled back inside! In addition, the ratio is forming a rising triangle. Expectations are that the ratio will break out to the top side of the triangle. This tells us that since June 16th, the NASDAQ 100 has been outperforming the Russell 2000. Note that this doesn’t mean that the NASDAQ 100 is moving higher at a faster pace than the Russell 2000. It could also mean that the NASDAQ 100 is just falling at a slower pace than the Russell 2000.
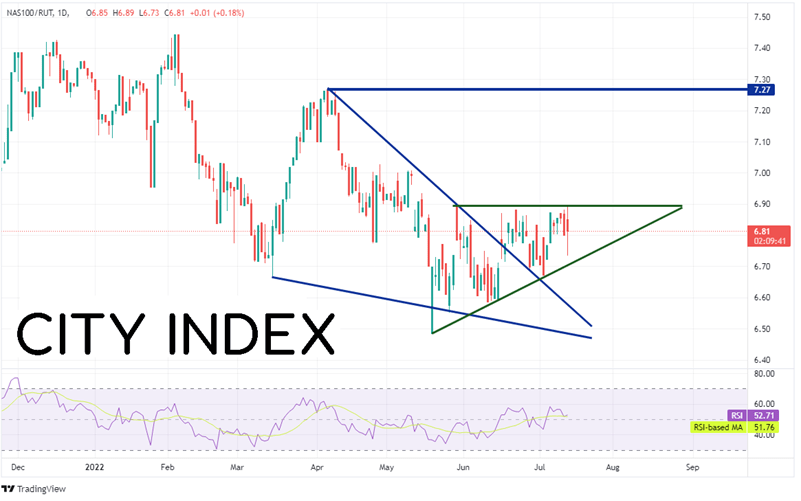
Source: Tradingview, Stone X
Q2 earnings for Big Tech is right around the corner. Are traders pricing in a better outlook for Q3 than the actual results from Q2? If so, it may mean that the NASDAQ 100 outperforms the Russell 2000 and that the ratio of the two indices moves higher!
Latest market news
Yesterday 01:32 PM
Yesterday 09:35 AM
Yesterday 07:23 AM
Yesterday 04:48 AM
Yesterday 12:17 AM
July 25, 2024 10:39 PM
Latest Trade Ideas articles

Yesterday 09:35 AM

Yesterday 12:17 AM

July 25, 2024 10:39 PM

July 25, 2024 05:30 PM