


October 12, 2022 3:15 PM

Due to a quirk in the economic calendar, September PPI was released the day prior to the September CPI. Most months, PPI is released the day after the CPI. This may have given the markets a forewarning of what’s to come from tomorrow’s CPI print. (See our complete CPI preview here). The headline print for September PPI was 8.5% YoY vs 8.7% YoY in August. This was the lowest reading since July 2021, but it also was a touch higher than the expectation of 8.4% YoY. In addition, Core PPI for September was a touch weaker at 7.2% YoY vs a previous reading of 7.2% YoY and an expectation of 7.3% YoY. This was the lowest reading since October 2021. Tomorrow’s CPI estimates are mixed, with the headline print expected to be weaker than the previous month and the Core Inflation Rate expected to be stronger than the prior month. Does the PPI data today give an indication as to what to expect from the CPI data?
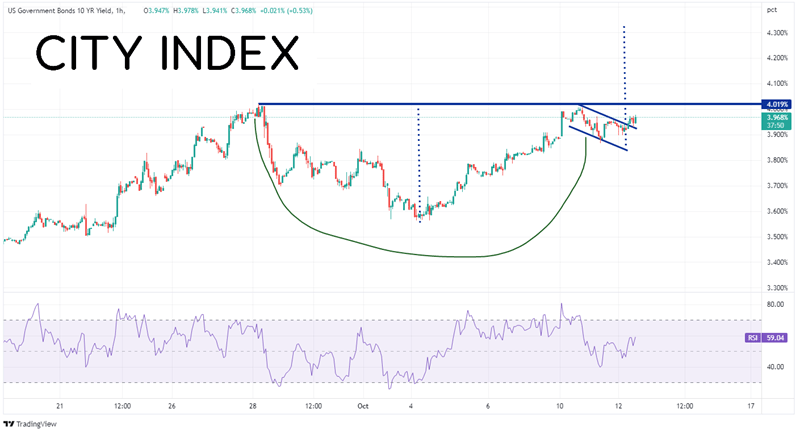
Although the PPI wasn’t a huge mover for the markets, it didn’t stop the current short-term trends from continuing either. US 10-year yields are continuing to advance on the short-term 60-minute timeframe. The benchmark yields appear to be breaking out of a cup-and-handle formation. If yields break above the September 28th highs at 4.019%, they could move to 4.325% in a hurry!

Source: Tradingview, Stone X
Trade US Bonds now: Login or Open a new account!
• Open an account in the UK
• Open an account in Australia
• Open an account in Singapore
In addition, the inflation figure couldn’t stop USD/JPY from screaming higher as traders sit on pins and needles waiting to see if the BOJ intervenes again. Recall that on September 22nd, the BOJ entered the market at 145.90 and sold USD/JPY down to a low of 140.35. Today. USD/JPY completed the retracement of that move before continuing higher. Where to next for USD/JPY? First resistance is at the 127.2% Fibonacci extension from the high to low of September 22nd at 147.41, then the August 1998 highs at 147.65. Above there, the pair can move to horizontal resistance from April 1990 at 148.90, then the 161.8% Fibonacci extension from the same timeframe near 149.33. However, if USD/JPY does pull back, first support is at the prior highs of 145.90, then the lows of October 5th at 143.53. Below there are the lows of September 22nd at 140.35. Note that if the BOJ intervenes again, price may drop back to 140.35 in a hurry.
Source: Tradingview, Stone X
Trade USD/JPY now: Login or Open a new account!
• Open an account in the UK
• Open an account in Australia
• Open an account in Singapore
With headline PPI higher than expected, traders may begin to look for the same from CPI tomorrow. 10-year yields and USD/JPY appear to be continuing with their moves higher as markets wait for the all-important inflation print. However, even if the CPI print comes in slightly worse than expected (say 7.8% YoY for the headline print), this is still much higher than the Fed’s 2% target and rate hikes are still likely to be aggressive.
Learn more about forex trading opportunities.
Latest market news
Today 12:54 AM
Yesterday 08:00 PM
May 4, 2024 08:00 AM
Latest Trade Ideas articles


May 4, 2024 08:00 AM

May 3, 2024 07:49 AM

May 3, 2024 07:01 AM