


- Gold analysis: Metal remains in dip-buying mode but fresh bull signal needed
- NFP and ISM services PMI both came in weaker
- Economic calendar lighter for US data in the week ahead

Friday’s key US macro highlights disappointed expectations, although there was more evidence that the fight against inflation will continue for a while. The US nonfarm payrolls report was weak, as too was the headline services PMI from the closely-watch ISM survey. Investors respond by selling the US dollar, and buying stocks, bonds and gold. Initially, the EUR/USD broke above 1.08 and the USD/JPY, already under pressure due to Japanese intervention signs, slumped below 152.00, while gold hit $2320+. But those moves unwound and gold hit a new weekly low of $2777 shortly afterwards, as the dollar eased off the lows. Investors were probably not convinced that one weak jobs report would put back on the table a rate cut by the end of the summer - not when the prices paid sub index of the ISM jumps to 59.2 vs 53.4 in the previous month. That being said, the jump in prices paid index comes after a huge drop the month before. All told, US data is showing weakness, especially survey-based indicators like the PMIs. The Fed, therefore, could cut rates at least a couple of times before the end of 2024, after all. But for the market to sharply reprice US interest rates lower again, more evidence of an economic slowdown is needed. Unfortunately, there won’t be much data to look forward to in the week ahead, until the UoM’s surveys on Friday.
Before we discuss the macro factors influencing gold prices in greater detail, let’s have a quick look at the chart of gold…
Gold analysis: Metal remains in dip-buying mode, but fresh bull signal needed
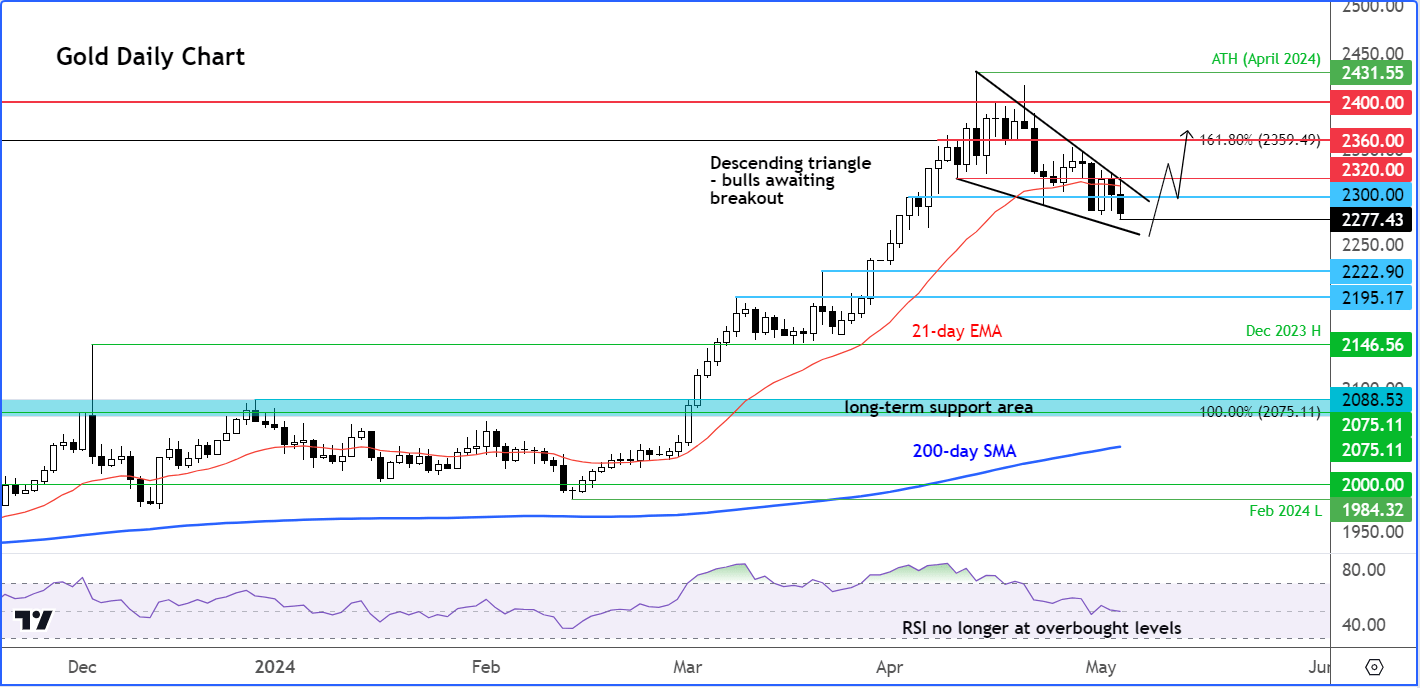
Source: TradingView.com
While the potential is there for the correction to extend, I think the risks remain skewed to the upside. The XAUUSD chart has been residing inside a falling wedge pattern in recent weeks following its record setting breakout in the preceding months. The consolidation has allowed momentum indicators like the RSI to work off their “overbought” conditions through time and price. What the bulls need to see now is a breakout above the resistance trend of the wedge pattern to signal a resumption in the trend. Will that happen in the week ahead remains to be seen. However, if the bearish price action persists instead, then I wouldn’t rule out a drop to the next support seen around $2222 to $2195 area.
How will the Fed respond to hot inflation and soft survey data?
Recent robust inflation figures have tempered expectations of rate cuts in 2024. But while hard data has been strong, until Friday’s jobs report, we have seen softer survey-based figures. Pointing to further economic weakness was Friday’s release of ISM services PMI which came in at 49.4 vs. 52.0 expected. The drop in contraction took the market by surprise and followed a weaker ISM manufacturing PMI and an abysmal Chicago PMI earlier in the week. However, the prices paid index was again higher, rising to 59.2 vs 53.4 in the previous month. This was also the case for the input prices in the manufacturing sector PMI, which rose at the fastest pace since 2022, fanning inflation fears further a day after we saw a bigger-than-expected rise in employment cost index. The ISM manufacturing PMI itself showed US factory activity fell in contraction after spending only one month in expansion threshold since September 2022.
So, higher inflation and weaker leading economic indicators point to a sharper economic downturn, which may require a faster pace of policy loosening down the line. Therefore, while the Fed may delay the start of the cutting cycle because of sticky inflation right now, once it starts cutting, we could see a fast move lower in interest rates. This argues against a sustained rise in the US dollar against currencies where the economic recovery is starting to take shape – for example the euro. It also argues against a big drop in gold prices.
NFP printed 175K, missing estimates
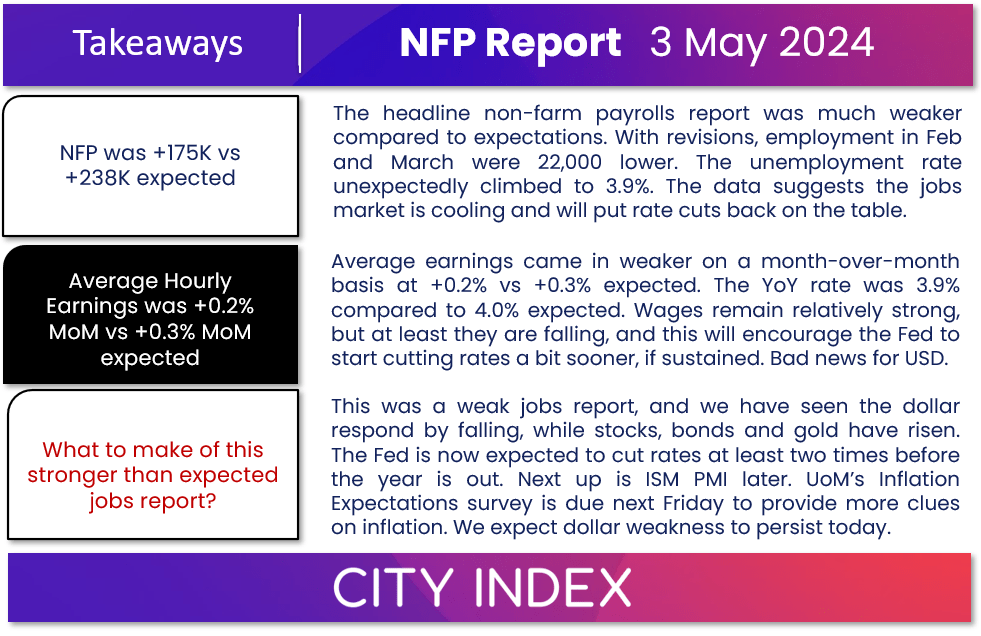
The headline non-farm payrolls report was much weaker compared to expectations. With revisions, employment in Feb and March were 22,000 lower. The unemployment rate unexpectedly climbed to 3.9%. The data suggests the jobs market is cooling and will put rate cuts back on the table, especially as Average Hourly Earnings also came in weaker. On a month-over-month basis, wages grew +0.2% vs +0.3% expected. The YoY rate was 3.9% compared to 4.0% expected. Wages remain relatively strong, but at least they are falling, and this will encourage the Fed to start cutting rates a bit sooner, if they don’t continue to grow at a stronger rate moving forward. All told, the NFP report was bad news for the dollar, and this should help to support gold prices.
Friday’s employment market data signalled the labour market is softening and comes after the JOLTS job openings reached their lowest point in over three years. Additionally, the quits rate dropped to its lowest level since August 2020, indicating a potential slowdown in wage growth in the upcoming months.
What to watch out for in the week ahead?
Well, it is not a massive week for US data, not after we have just had the Fed’s policy decision, NFP and various other economic indicators. Following the Fed’s meeting, investors were left scratching their heads. Powell quashed expectations of a rate hike this year, but the Fed Chair also indicated that the central bank was in no rush to start cutting interest rates – something that was widely expected anyway. However, ongoing concerns about persistent inflationary pressures that have been reflected in various economic indicators remain. Those concerns could intensify if the University of Michigan’s Inflation Expectations survey shows a further increase, come Friday 10th May. Inflation expectations have been climbing steadily in recent months from 2.9% in January to 3.2% in April. This is the percentage that surveyed consumers (about 500) expect the price of goods and services to change during the next 12 months, which is a leading indicator of inflation. It will need to weaken to help fuel a drop in US dollar and a fresh rally in gold.
Gold analysis: There is no question about the metal’s longer-term outlook
Gold has been supported because of years of high inflation chipping away at the value of fiat currencies, before its recent weakness. Still, with many investors missing out on the recent surge in gold and silver prices, they are now monitoring prices for dib-buying opportunities. Advocates for precious metals emphasise their recent resilience in the face of a strong dollar and rising bond yields. They contend that with prices no longer excessively overbought, the upward trajectory could continue, especially considering the metals’ underlying factors like ongoing central bank acquisitions of gold and the role of precious metals as an inflation hedge. Years of excessive inflation means fiat currencies have significantly depreciated. This is a trend that will continue for a while yet given the sticky nature of inflation in many countries. So, it is likely that demand for precious metals as a dependable safeguard against inflation is likely to remain strong.
-- Written by Fawad Razaqzada, Market Analyst
Follow Fawad on Twitter @Trader_F_R
How to trade with City Index
You can trade with City Index by following these four easy steps:
-
Open an account, or log in if you’re already a customer
• Open an account in the UK
• Open an account in Australia
• Open an account in Singapore
- Search for the company you want to trade in our award-winning platform
- Choose your position and size, and your stop and limit levels
- Place the trade
Latest market news
Today 02:00 AM
Yesterday 03:00 PM
Yesterday 02:12 PM
Yesterday 01:23 PM
Yesterday 12:15 PM
Latest Gold articles

May 10, 2024 12:36 AM

May 9, 2024 10:15 PM

May 8, 2024 04:00 PM

May 8, 2024 05:09 AM