


View related gold analysis:
Gold forecast: Seasonals point to Jan gains, or did gold peak to soon?
I highlighted in last week’s article that whilst gold tends to perform well in January, it may struggle to do so this year. It’s already delivered strong returns in the three months of Q4 and the tide could be turning in the US dollar’s favour.
Gold is currently down -1.8% in January, but I see further downside potential given false break of the previous record high alongside the growing case for a stronger US dollar. But that doesn’t mean gold will fall against everything by the same degree, if at all.

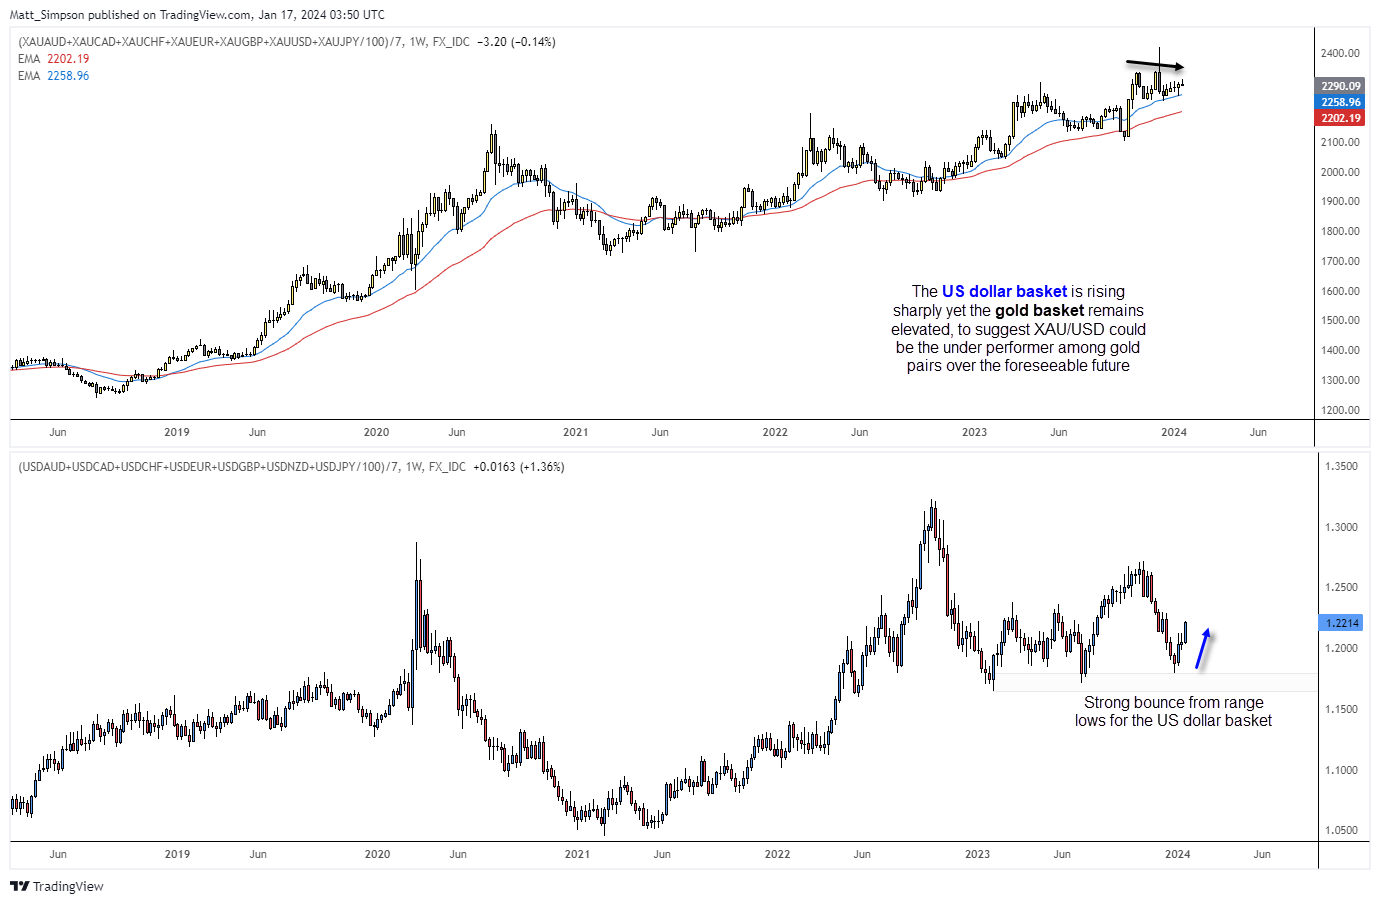
Gold basket (top), USD basket (bottom), equally weighed against FX majors
The gold basket has delivered a steady uptrend against all fore majors overall and, whilst it saw a volatile jolt in December at its record high, we’re yet to see gold fall materially overall. This shows us that gold remains a favoured asset among investors, and even if prices turn broadly lower the established trend favours it to be a retracement over a trend reversal.
However, the US dollar basket is rising sharply from its range lows. The dollar remained supported throughout 2023 and even posted a slightly higher low in July and December. At current levels the US dollar basket is on track for its best week since November. The fact that the gold basket remains elevated whilst the US dollar basket rises sharply tips us off that gold against the US dollar (XAU/USD) is likely to be the weakest go pair over the near term or longer. Ultimately, moves in global markets are now dictated by a shift in sentiment towards the Fed, which directly impacts yields and the US dollar, from which other markets take their cue.
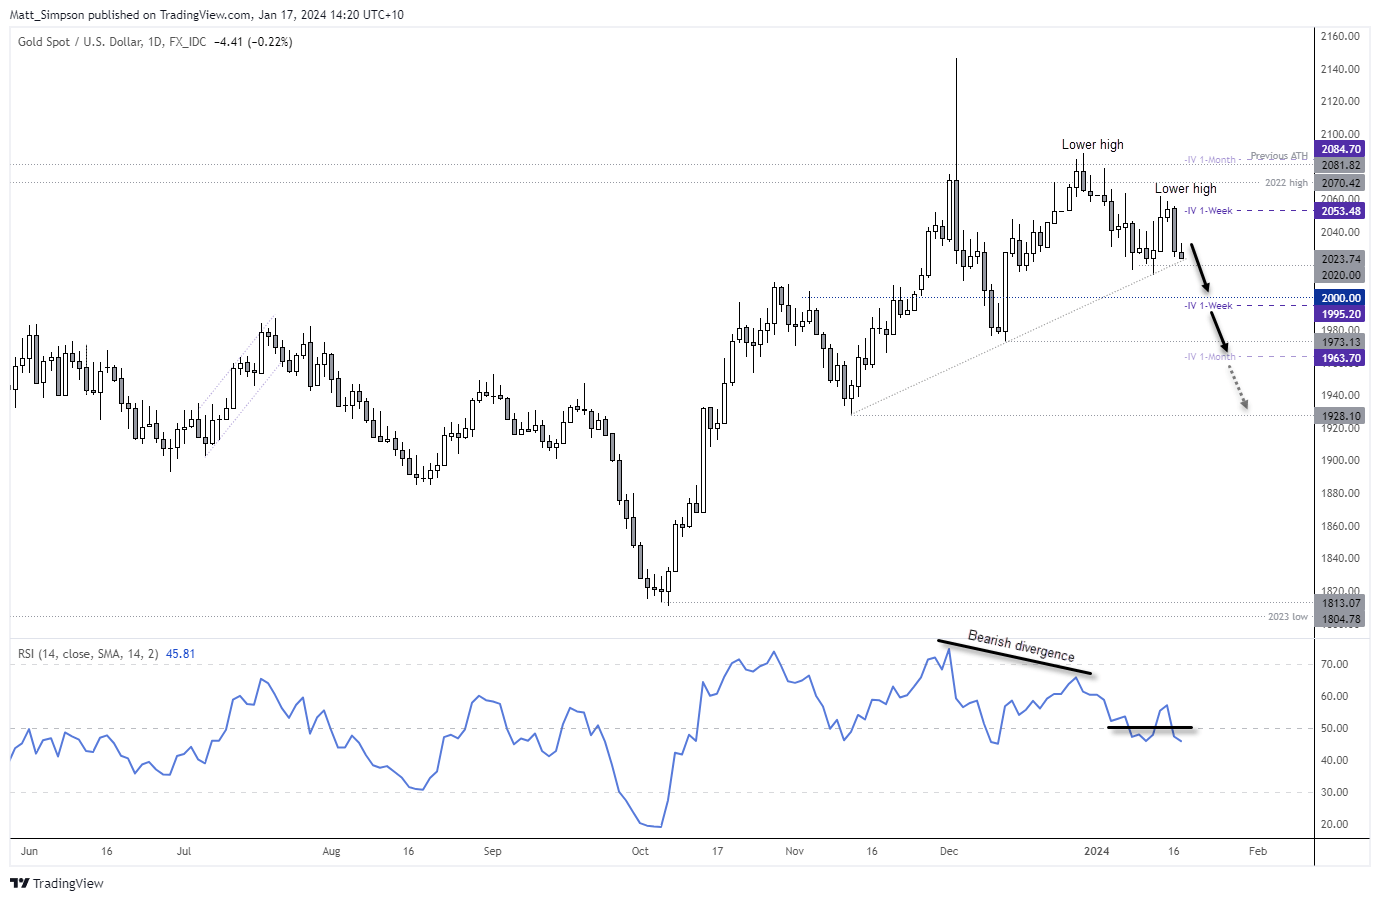
Gold technical analysis (daily chart):
Last week the bias was for prices to bounce from the $2020 area and head for $2050 before rolling over. So far, so good. There is an ‘internal’ trendline on the daily chart to consider, but this will be invalidated with a break beneath $2020 anyway. RSI (14) is now below 50 to show bearish momentum following its bearish divergence.
From here I favour a move down to $2000 so bears can seek to enter bearish consolidations or continuation patterns on intraday timeframes or fade into minor rallies. A break beneath 2014 warns of a trend reversal on the daily chart.
$2000 is likely to provide support given its round-number status. Also note the lower 1-week implied volatility band sits just beneath this level. Once the obligatory bounce from $2000 is done and dusted, the bias is for a break beneath it and for a move towards the $1973 low and 1-month vol band.
-- Written by Matt Simpson
Follow Matt on Twitter @cLeverEdge
How to trade with City Index
You can trade with City Index by following these four easy steps:
-
Open an account, or log in if you’re already a customer
• Open an account in the UK
• Open an account in Australia
• Open an account in Singapore
- Search for the market you want to trade in our award-winning platform
- Choose your position and size, and your stop and limit levels
- Place the trade
Latest market news
Yesterday 01:32 PM
Yesterday 09:35 AM
Yesterday 07:23 AM
Yesterday 04:48 AM
Yesterday 12:17 AM
July 25, 2024 10:39 PM
Latest Trade Ideas articles

Yesterday 09:35 AM

Yesterday 12:17 AM

July 25, 2024 10:39 PM

July 25, 2024 05:30 PM