


- Bullish momentum is waning
- There's a slight RSI (2) divergence
- Three upper wicks show a reluctance to hold above $2500 immediately
And this places a potential retracement lower on the cards. Yet as much as that excites the potential for a pullback, it's difficult to construct an overly bearish case with the current backdrop of geopolitics and potential CB easing. So the basic thesis is that any pullback at this stage may be limited, and bears may want to be nimble with their shorts. At the same time, these may not be the levels bulls want to reload either.
Ultimately, unless we see the gold basket or XAU/USD dip back within 2-day bullish rally on March 1st and 2nd (below the prior ATH), any retracement could be limited.
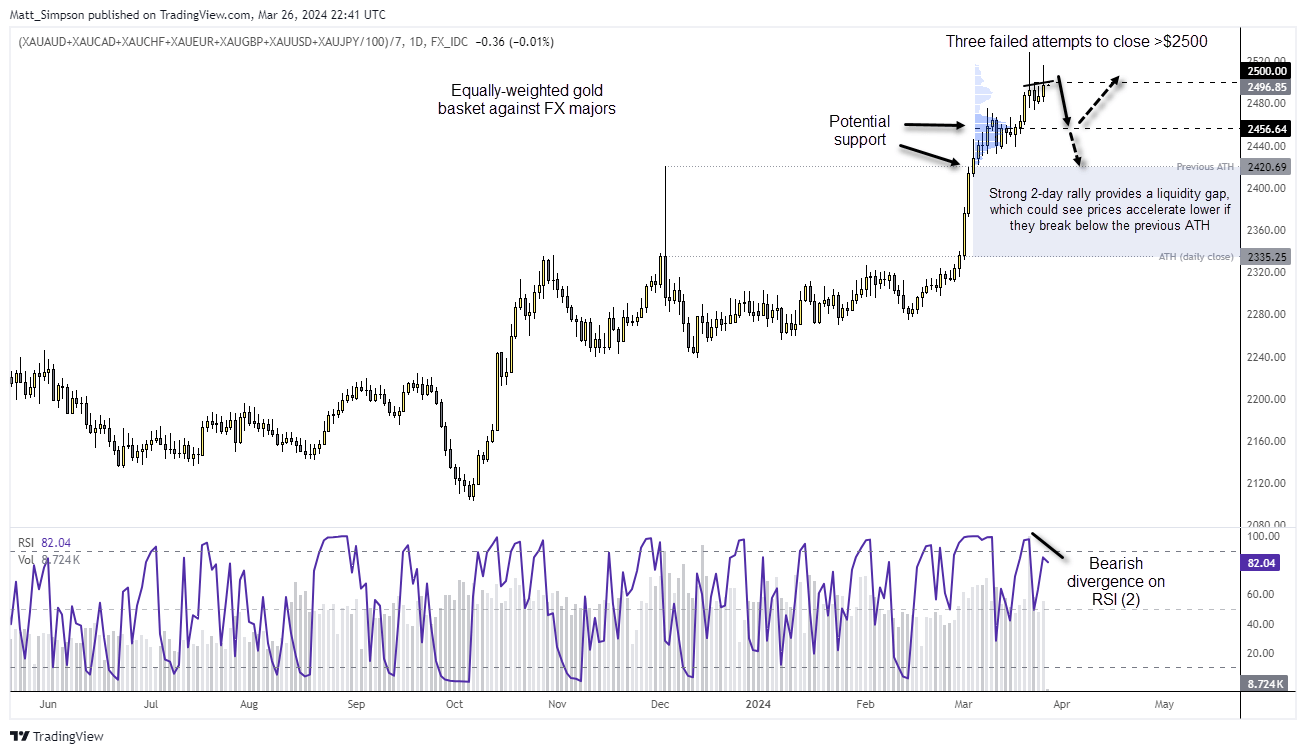
And specifically, there's a nice volume cluster around $2456 on the gold basket which could act as support initially, which equates to a -1.7% move lower from current levels A break beneath here brings the previous ATH (all-time high) into focus, which is around -3% from current levels. And as the rally for gold has been broad-based, XAU/USD traders may want to monitor the general performance of gold to better pick potential swing points on gold against the US dollar.

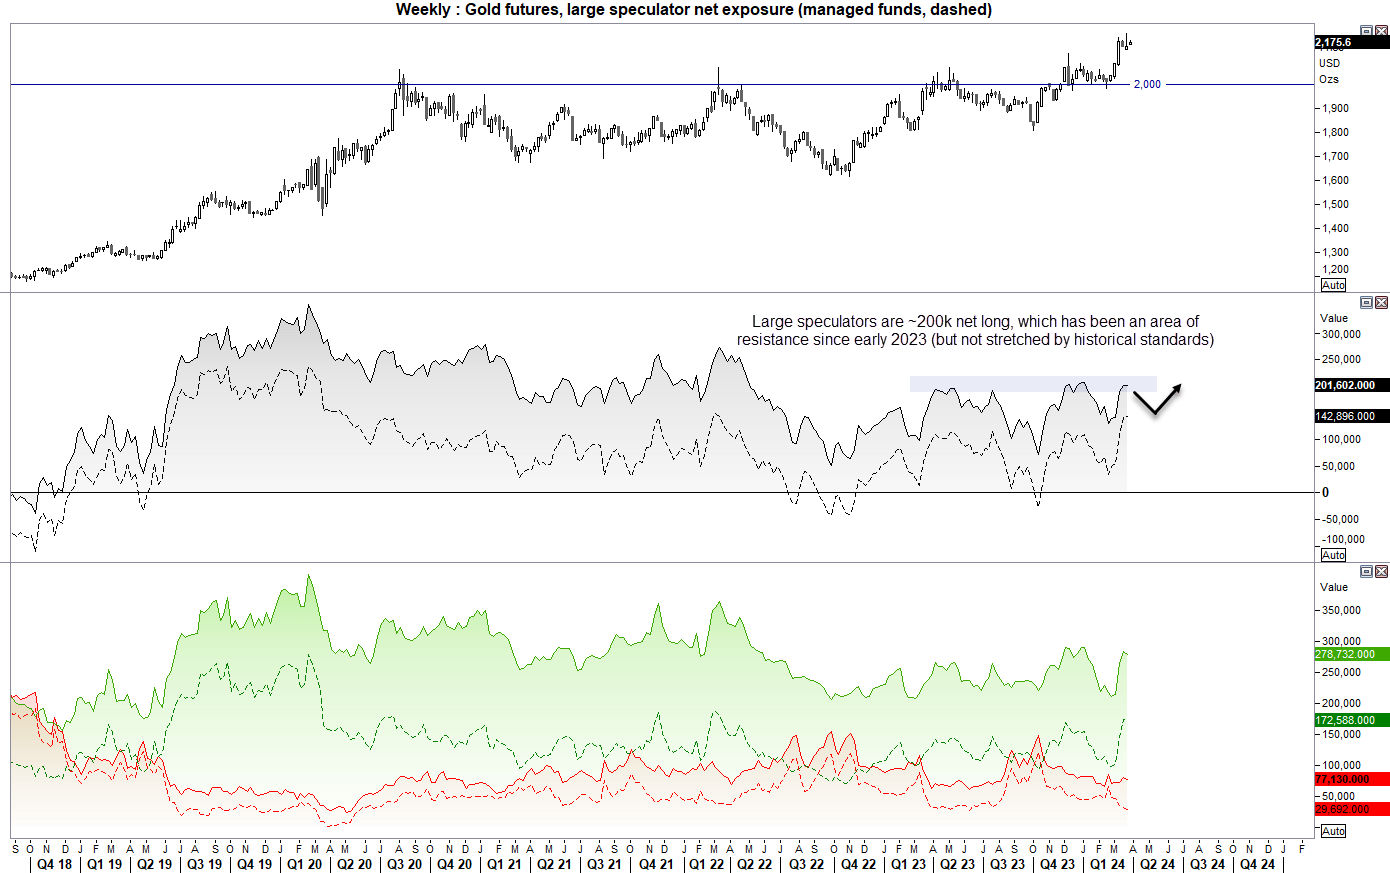
Gold market positioning from the COT report:
A look at positioning also shows support for XAU/USD futures (gold in US dollars) with large speculators and managed funds trimming shorts with longs trending higher. Sure, there's a case for gold to lose some steam with large specs ~200k net long and managed funds ~140k net long, but net-long exposure is not extreme by historical standards. And this further suggests that any pullback may be limited without
Gold technical analysis:
The rally to new highs on gold against the US dollar seems less impressive than the broad-based rally on the gold basket. And that is down to the strength of the US dollar. Yet the potential for at least a near-term reversal on gold seems apparent here too. A bearish divergence has formed on RSI (2) and RSI (14), two bearish pinbars have formed – one of which is a lower high and both failed to close above $2200. In fact, Tuesday’s bearish pinbar met resistance at the $2200 handle.
There is also a potential head and shoulders top on the daily chart, which projects a target around $2070, near the 2020 high.
- For now, the bias is for a move to $2050, and bears could fade into minor rallies whilst prices remain below $2200.
- A break below $2046 confirms the head and shoulders pattern, although for that to happen we likely need to see the gold basket also break below its prior all-time high.

-- Written by Matt Simpson
Follow Matt on Twitter @cLeverEdge
How to trade with City Index
You can trade with City Index by following these four easy steps:
-
Open an account, or log in if you’re already a customer
• Open an account in the UK
• Open an account in Australia
• Open an account in Singapore
- Search for the market you want to trade in our award-winning platform
- Choose your position and size, and your stop and limit levels
- Place the trade
Latest market news
Yesterday 01:32 PM
Yesterday 09:35 AM
Yesterday 07:23 AM
Yesterday 04:48 AM
Yesterday 12:17 AM
July 25, 2024 10:39 PM
Latest Trade Ideas articles

Yesterday 09:35 AM

Yesterday 12:17 AM

July 25, 2024 10:39 PM

July 25, 2024 05:30 PM