


October 12, 2022 8:41 PM
Recall that during the September 21st FOMC meeting, the Committee chose to hike the Fed Funds rate by 75bps for the third consecutive meeting to bring the key rate to 3%-3.25%. The Minutes from that meeting noted that the cost of doing too little outweighed the cost of doing too much. They also noted that the labor market would need to weaken to bring down high inflation. Several also said that after rates reach a sufficient level, they will need to hold this restrictive rate for “some time”. In addition, the Minutes went on to say that at some point it would be appropriate to slow the pace of rate increases while assessing the cumulative effects of policy adjustments. Some may be splitting hairs as to whether this last statement is a Fed Pivot, but it seems to just be members commenting on the path of rate hikes, rather than the pace of rate hikes.
Everything you need to know about the Federal Reserve
After the Minutes were released, the CME FedWatch Tool showed that markets were pricing in an 84% chance of a 75bps rate increase at the November 2nd meeting. However, this may change after the US CPI data is released tomorrow.
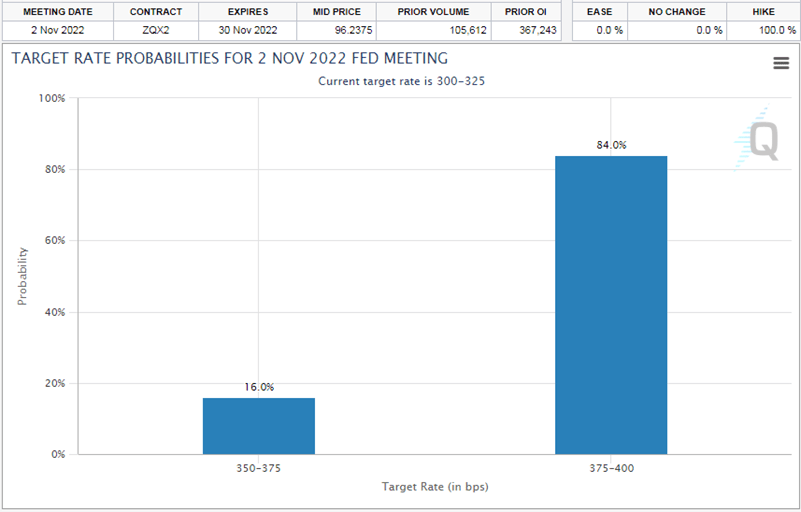
Source: CME
The US Dollar Index has been moving aggressively higher since the end of March as it became apparent that the Fed would be hiking rates at a faster pace than initially thought. The DXY traded in an orderly channel from 97.69 on March 31st to 114.79 on September 28th. It then pulled back to horizontal support just above the bottom trendline of the channel, near 110.05, and has been moving higher since. On Monday the DXY reached the 61.8% Fibonacci retracement from the highs of September 28th to the lows of October 4th near 112.97 and has been oscillating around that level.
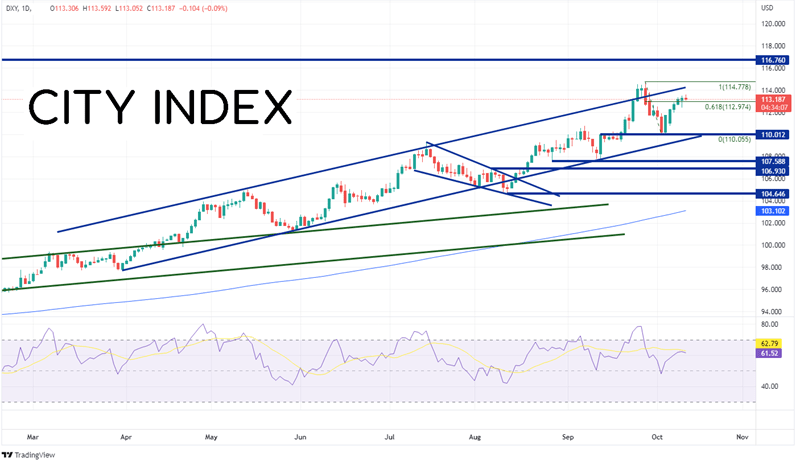
Source: Tradingview, Stone X
Trade the DXY now: Login or Open a new account!
• Open an account in the UK
• Open an account in Australia
• Open an account in Singapore
On a 240-minute timeframe, the DXY is nearing the apex of a symmetrical triangle. If the US Dollar Index breaks higher, the first resistance is at the September 28th highs of 114.79. Above there, price can move to the 161.8% Fibonacci extension from the highs of September 28th to the lows of October 4th near 116.04 and then horizontal resistance from March 2002 at 116.76. However, if the DXY breaks lower out of the triangle, first support is at the lows of October 11th at 112.41, then the lows of October 4th at 110.06. Below there, strong horizontal support dating to July 14th crosses at 109.29.
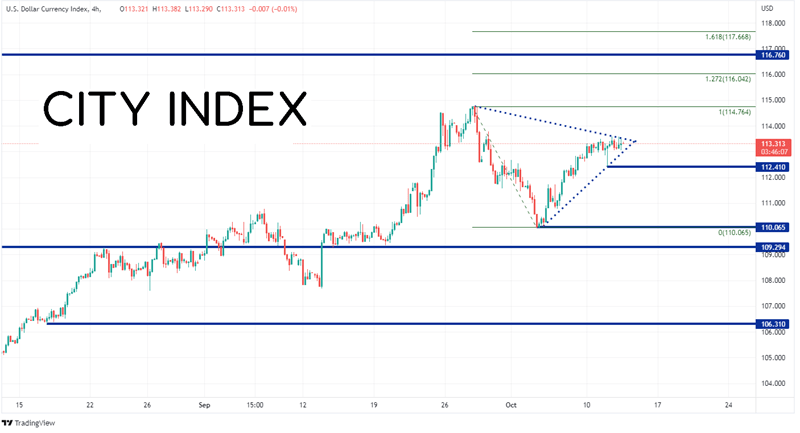
Source: Tradingview, Stone X
With the Fed raising 75bps at its September meeting, the FOMC Minutes noted that the risks of doing too little outweighed the risk of doing too much. Despite what some may see as a potential Fed Pivot moment, the CME Fedwatch Tool showed that there was an 84% chance of a 75bps rate hike on November 2nd. What will markets think after tomorrows CPI data? Watch the DXY to find clues as to what the Fed may do next!
Learn more about forex trading opportunities.
Latest market news
Yesterday 01:32 PM
Yesterday 09:35 AM
Yesterday 07:23 AM
Yesterday 04:48 AM
Yesterday 12:17 AM
July 25, 2024 10:39 PM
Latest Forex articles

Yesterday 12:17 AM

July 25, 2024 10:39 PM

July 25, 2024 03:59 PM

July 25, 2024 04:37 AM