


July 15, 2022 4:20 PM

Fed member Christopher Waller said yesterday that despite a 40-year high CPI reading at 9.1% YoY, he still supports a 75bps rate hike at the upcoming FOMC in late July. However, he also noted that if June Retail Sales and housing data “come in materially stronger than expected, it would make me lean towards a larger hike.” June’s Retail Sales data released earlier today showed that the headline number rose by 1% MoM vs 0.8% MoM expected and a higher revised print for May to -0.1% MoM. In addition, the Ex-Autos print was also 1% MoM vs 0.6% MoM expected and a higher revised print for May to +0.1% MoM.
USD/JPY has been moving aggressively higher since breaking above 116.35 on March 11th. The pair moved to 131.33 on May 9th as it became apparent that higher US inflation data would lead the Fed to hike interest rates more aggressively. USD/JPY then pulled back in a descending wedge formation as the RSI diverged in overbought territory. On May 31st, USD/JPY broke out of the wedge and continued its move higher. On July 14th, the pair reached its highest level since September 1998 at 138.94. However, notice that the RSI is diverging with price in overbought territory once again. Does that mean price is ready for a correction once again ahead of the September 1998 highs at 139.91?
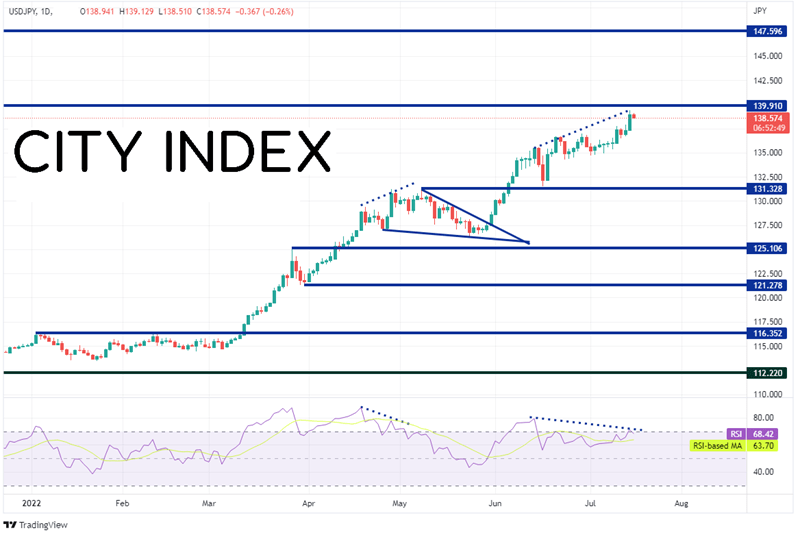
Source: Tradingview, Stone X
Trade USD/JPY now: Login or Open a new account!
• Open an account in the UK
• Open an account in Australia
• Open an account in Singapore
On a 240-minute timeframe USD/JPY made a high on July 11th at 137.75, before pulling back in a pennant formation to the 50% retracement level from the lows of July 7th to the highs of July 11th near 137.93. USD/JPY then broke out of the pennant and ran higher to the July 14th highs of 138.94. The pair is currently pulling back in what could be another pennant formation. Support below is at the 38.2% Fibonacci retracement level from the low of July 12th to the high of July 14th at 138.27. Just below there is the 50% retracement level form the same timeframe near 137.93 and then the highs from July 11th at 137.75. If price follows the same pattern as the previous pennant, price would bounce from the 50% retracement level. This would target near 141 on the breakout of the pennant. However, USD/JPY would have some work to do to get there. First resistance is at the top, downward sloping trendline of the pennant near 138.93. Above there, resistance is at the highs from July 14th at 139.39, then the September 1998 highs at 139.91.
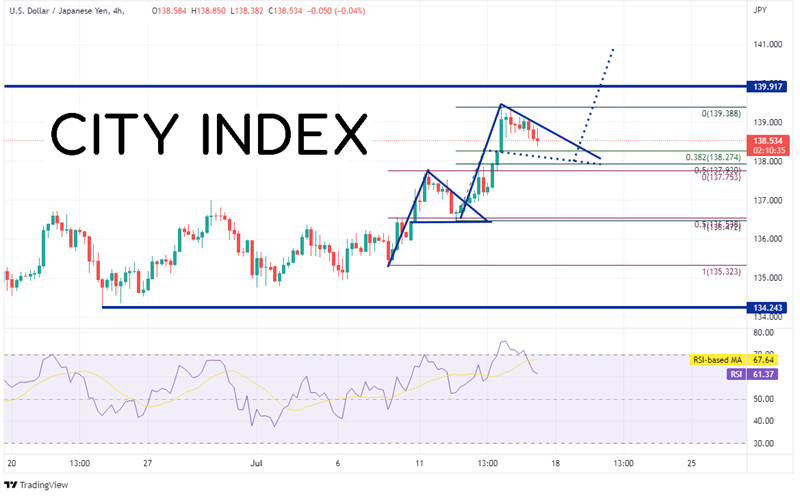
Source: Tradingview, Stone X
“Never bet against the American consumer” is a phrase that has been thrown around the street, and June’s data shows why. But will it be enough to for the Fed to consider raising rates by 100bps at it July meeting in 2 weeks? Waller also mentioned the housing data would play a part in his decision. Watch the housing price index, existing house sales, and building permits next week for more guidance!
Learn more about forex trading opportunities.
Latest market news
Yesterday 01:32 PM
Yesterday 09:35 AM
Yesterday 07:23 AM
Yesterday 04:48 AM
Yesterday 12:17 AM
July 25, 2024 10:39 PM
Latest Trade Ideas articles

Yesterday 09:35 AM

Yesterday 12:17 AM

July 25, 2024 10:39 PM

July 25, 2024 05:30 PM