


June 1, 2020 12:34 PM

The first week of June brings a plethora of economic data which could affect the next long-term trend of AUD/USD. For Australia, the most notable event will be the RBA Interest Rate Decision. Although no change is expected, traders and investors will undoubtedly be watching the language in the statement. With Australia re-opening is economy, traders will be watching to see if the RBA strikes a “less dovish” tone, as RBA Governor Philip Lowe has indicated that negative rates are not on the table for now. In addition, Australia will release its Q1 GDP Growth Rate. Expectations are for -0.3% vs 0.5% last. Although Q1 ended over a month ago, traders will be watching to see how “bad” things actually got and look for clues as to what may lie ahead for Q2. In the US, the economic highlight will be Nonfarm Payroll data on Friday. Expectations are for a decrease on 8,000,000 jobs compared to an April figure of -20,500,000. Although expectations are for a significantly better print, -8,000,000 is still a terrifying figure.
In addition to the economic data this week, geo-political factors could play a role in the direction of AUD/USD. The most significant will be retaliation from China towards the US over possible sanctions due to China’s involvement in Hong Kong. In addition, the US is studying the differing practices of Chinese companies listed on US stock exchanges. This may prompt some Chinese firms to delist from US exchanges. We already saw some early signs of retaliation as China said it will halt some soy and pork imports from the US. This puts the trade agreement between the US and China into jeopardy. Why would US-China relationships affect AUD/USD? The reason is that Australia is dependent on China’s economy. Therefore, if there is a possibility a slowdown in China’s economy (as we saw with the coronavirus), it will directly affect Australia and the Australian Dollar.
AUD/USD is in breakout territory and appears on its way to retest the December 31st, 2019 highs. The pair has already taken out the 200-day moving average (which provided resistance last week) and the 78.6% Fibonacci retracement level from the December 31st highs to the March 19th lows. Since early March, AUD/USD has been highly correlated with the S&P 500, with a correlation coefficient of +.92. For reference, a correlation coefficient of +1.00 means that the 2 assets are perfectly correlation and move together 100% of the time. Therefore, traders need to keep an eye on the S&P 500, which could provide clues to a turn in AUD/USD. First level of resistance is at .6838. If price breaks through there, it could run up to the December 31st highs near .7040. Horizonal support comes across at the 200 Day Moving average and the bottom trendline of the channel the pair as been in since mid-March near .6654.
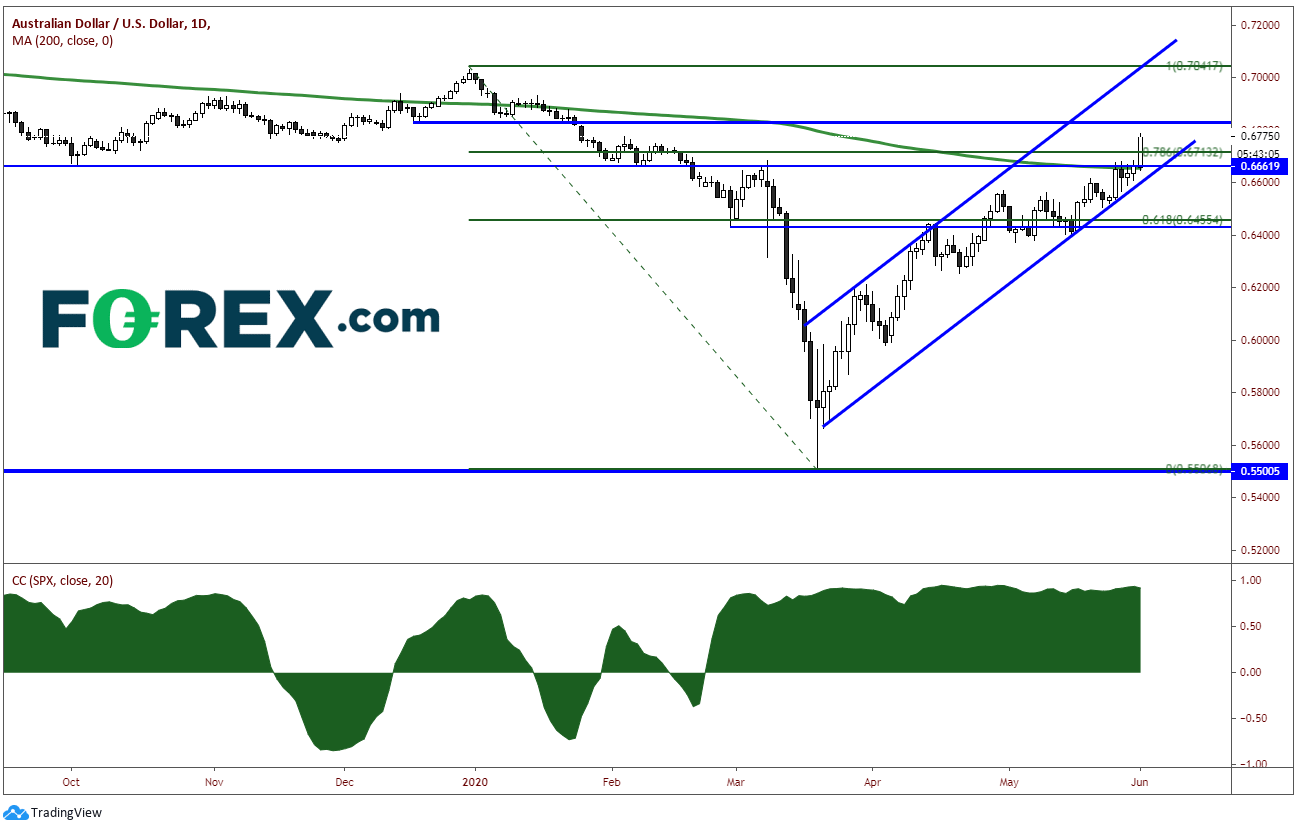
Source: Tradingview, Forex.com
Latest market news
Yesterday 01:32 PM
Yesterday 09:35 AM
Yesterday 07:23 AM
Yesterday 04:48 AM
Yesterday 12:17 AM
July 25, 2024 10:39 PM
Latest Forex articles

Yesterday 12:17 AM

July 25, 2024 10:39 PM

July 25, 2024 03:59 PM

July 25, 2024 04:37 AM