It has long been said that the Fed’s favorite measure of inflation is Core PCE. But has that changed? The Fed raised rates by 75bps at its June meeting. Expectations were only for a 50bps hike. That is, until the Fed leaked the news to the WSJ that it was going to hike 75bps just days before the decision. Why did the Fed change its collective mind? The CPI print for May was 8.6% YoY and the Michigan Consumer Inflation Expectations Index was higher than expected. During the press conference following the FOMC decision, Fed Chairman Powell said that the Fed was concerned about ALL inflation (not just ex- food and energy).
Regardless, later this week, the US will release the May PCE Price Index and the Fed’s “favorite” measure on inflation, Core PCE. Expectations for the headline print are for 6.7% YoY, up from 6.3% YoY in April. In addition, the Core PCE Price Index is expected to fall to 4.8% YoY vs 4.9% YoY in April. The expectations for the Core print tell us that economists think that the majority on inflation for May is expected to be outside of food and inflation! If the prints come in higher than expected, this Fed may give the Fed more ammo to hike 75bps. If the prints are weaker than expected, the Fed may be more inclined to only hike rates by 50bps at the July meeting.
Everything you need to know about the Federal Reserve
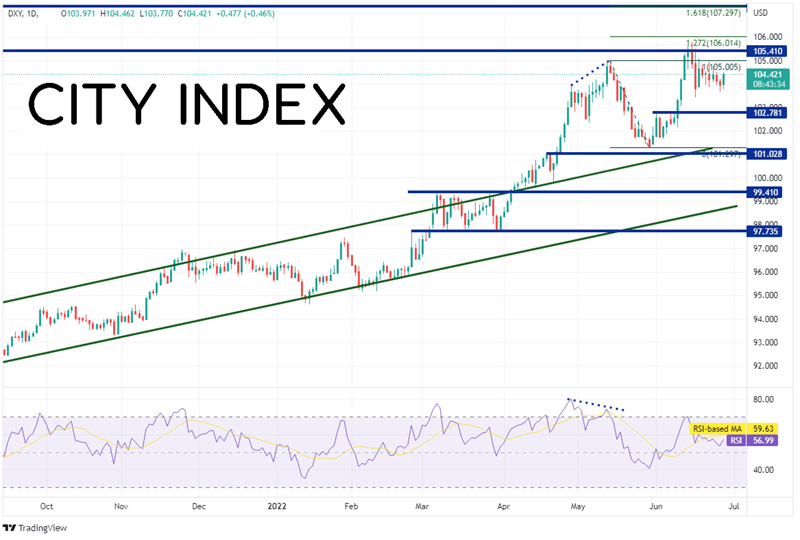
The US Dollar Index has been on the rise in an orderly channel since May 2021. However, on April 6th, the DXY moved aggressively above the channel and traded as high as 105.00 on May 13th. The index then pulled back to horizontal support as the RSI diverged with price in oversold territory, just above the April 19th highs near 101.03. Since then, the Fed began aggressively raising rates, by 50 bps at the May meeting and 75bps at the June meeting. This sudden, quickened pace caught some DXY traders by surprise and the US Dollar index traded to a high of 105.79, its highest level since December 2002.

Source: Tradingview, Stone X
Trade the DXY now: Login or Open a new account!
• Open an account in the UK
• Open an account in Australia
• Open an account in Singapore
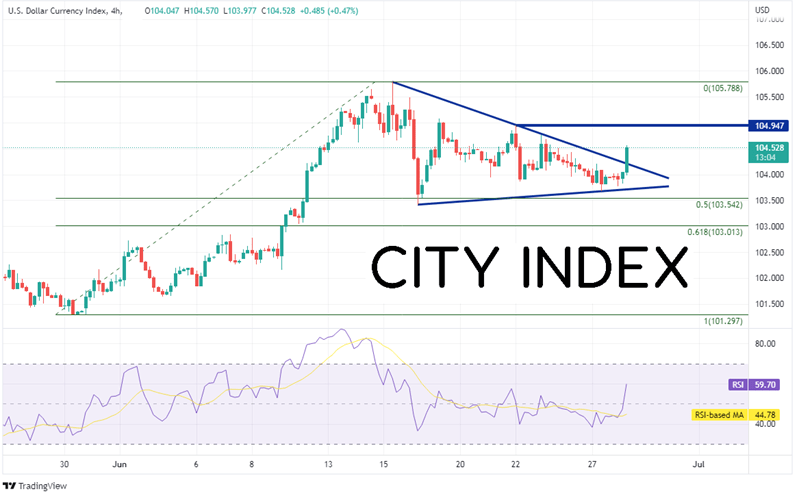
On a 240-minute timeframe, the DXY pulled back from the recent highs to the 50% retracement level from the lows of May 30th to the highs of June 15th near 103.50 and has been oscillating within a symmetrical triangle since then. On Tuesday, the US Dollar Index broke higher out of the top of the triangle. First resistance is at the highs from June 22nd near 104.95. Above there, price can move to the highs from June 15th at 105.79, then the 127.2% Fibonacci extension from the highs of May 13th to the lows of May 30th at 106.01 (see daily). However, if the DXY moves lower, the first support is back at the triangle breakout level near 104.20. Below there, the pair can trade to the bottom trendline of the triangle and the June 27th lows at 103.67. The third level of support is at the 50% retracement from the May 30th low to the June 15th highs at 103.54.

Source: Tradingview, Stone X
US Core PCE is due out this week and if it is similar to other recent inflation data, it may be stronger than expected. This may give the Fed more confidence to hike rates by 75bps at the July meeting. However, if it is weaker than expected, the Fed may only end up hiking rates by 50bps!
Learn more about forex trading opportunities.


