


I have been quite vocal over the past couple of months about Bitcoin’s tendency to get choppy, volatile and unfriendly whenever it reaches the $60k-$70k zone. And it was no different this time around; Bitcoin entered the usual parabolic phase of the rally, media coverage of it exploded, the record high was achieved – then the inevitable shakeout began.
You can view my prior analysis which laid the groundwork for the current shakeout below. But the question I now have is whether it will follow the usual route of a 50-70% bear market or hold ground, before extending its rally and heading for the much-touted $100k.
Related bitcoin analysis:
Bitcoin bulls eye record highs - but we could see some ‘chop at the top’
Bitcoin falters at $70k yet again, volatility could be set to remain
Bitcoin forecast: BTC could retest $70k before its next leg lower
The halving is here:
As with prior cycles, the halving got plenty of coverage for Bitcoin’s post-halving rallies. Perhaps too much coverage… when everyone is talking about the same event and its propensity to send a market a particular direction, I get nervous. It’s akin to the classic ‘gold bubble’ stories to be wary of buying gold if the taxi driver advises you to do so, as it suggests being long is a crowded trade.
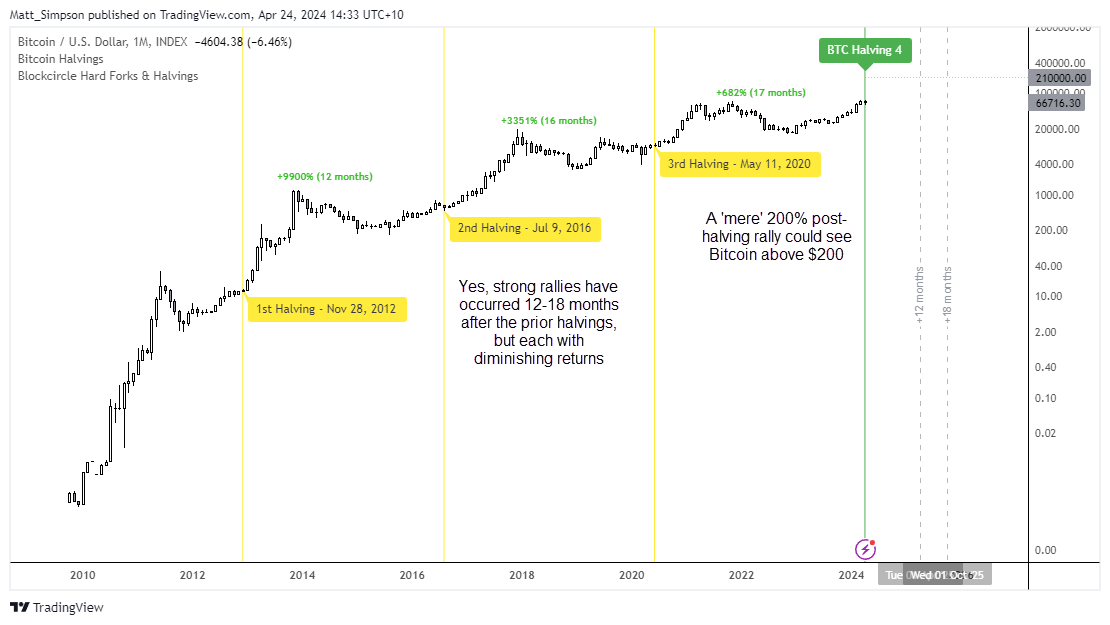
Still, the prior three halving have provided eye-watering gains, even if they have diminished with each cycle. Even if Bitcoin ‘only’ rises 200% in the 12-18 months of this halving cycle, it could see Bitcoin trading above $200k by 2025. And the diminishing gains make sense, as institutional activity is now a dominant force on Bitcoin, especially since the CEM futures contract was initially launched in 2017. The trouble is, futures contracts allow institutional to hedge, and in doing so volatility is suppressed. This is not necessarily a bad thing, but I doubt we will simply see the market rise to $300k simply because this is what bulls wish. Besides, Bitcoin is now essentially linked to the stock market. And if inflation returns and equity markets decline, the chances are that Bitcoin will follow.
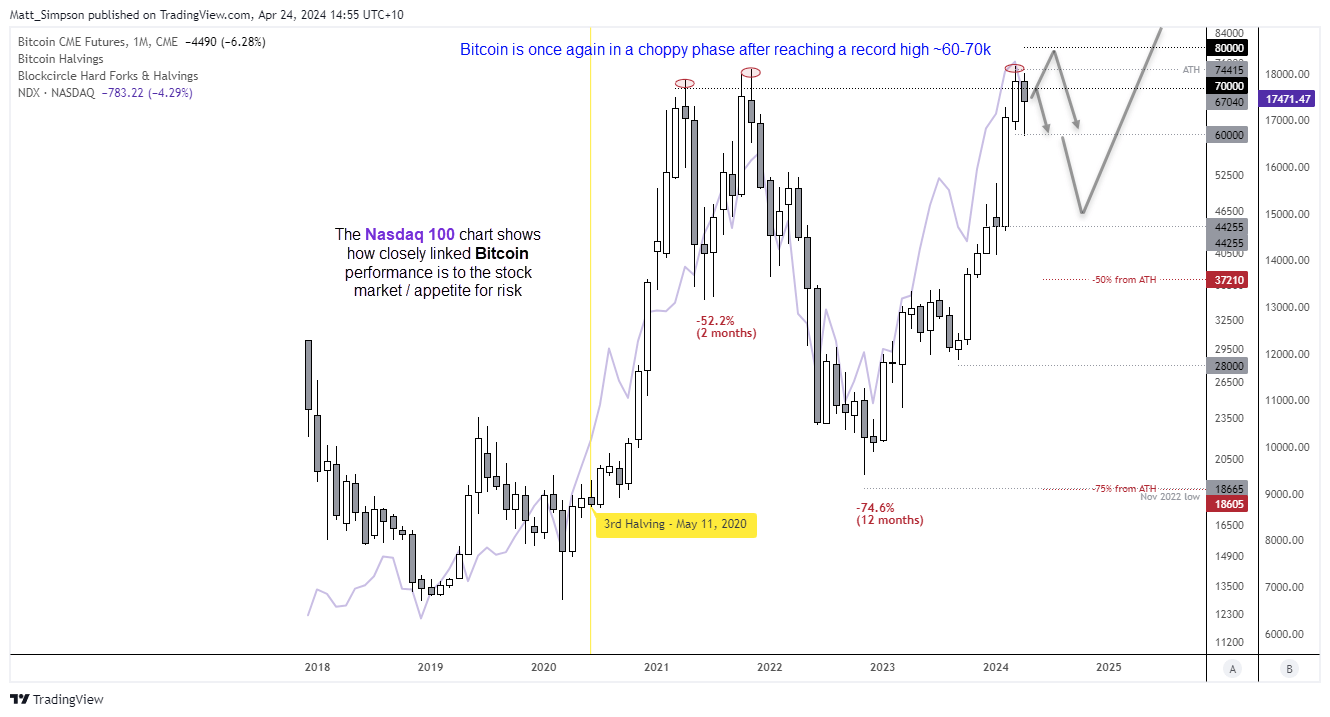
Bitcoin really does just track the stock market these days
This chart shows the Bitcoin futures contract alongside the Nasdaq 100 monthly chart. Whilst not perfect, hopefully you can see how closely related they are. And as equity traders factor in growth expectations, inflation expectations and therefore Fed policy into their stock market outlook, Fed policy inadvertently has an impact on Bitcoin.
I chose the Bitcoin futures contract as it better encapsulates the time when institutional activity took place, and I trust the volume data from the CME over a crypto exchange.
The monthly chart shows that the record high failed to hold above $70k before retracing. It remains too soon to confirm if this is simply a pause in trend or beginning of a large decline (like twice in 2021), but it strongly suggests that ‘strong’ institutional hands have been unloading at these highs.
For Bitcoin to rally over the coming months likely requires inflation to moderate, the Fed cut rates and the stock market rally. Given that inflation is pointing higher, US data remains robust, and the Fed tend to hold or hike rates until something breaks, I’m veering towards a stock market correction this year. And that could weigh on Bitcoin.
That doesn’t mean it cannot tap $80k first. But I am doubtful of double-digit gains from here. Besides, we’re in the famous ‘choppy trade around record highs’ phase, which means traders may want to refer to lower timeframes and seek swing trades in both directions, until a clear macro trend emerges.
$80k makes a viable upside target for any breakout, but it likely requires broad risk on, low inflation and prospective Fed cuts to hold above it.
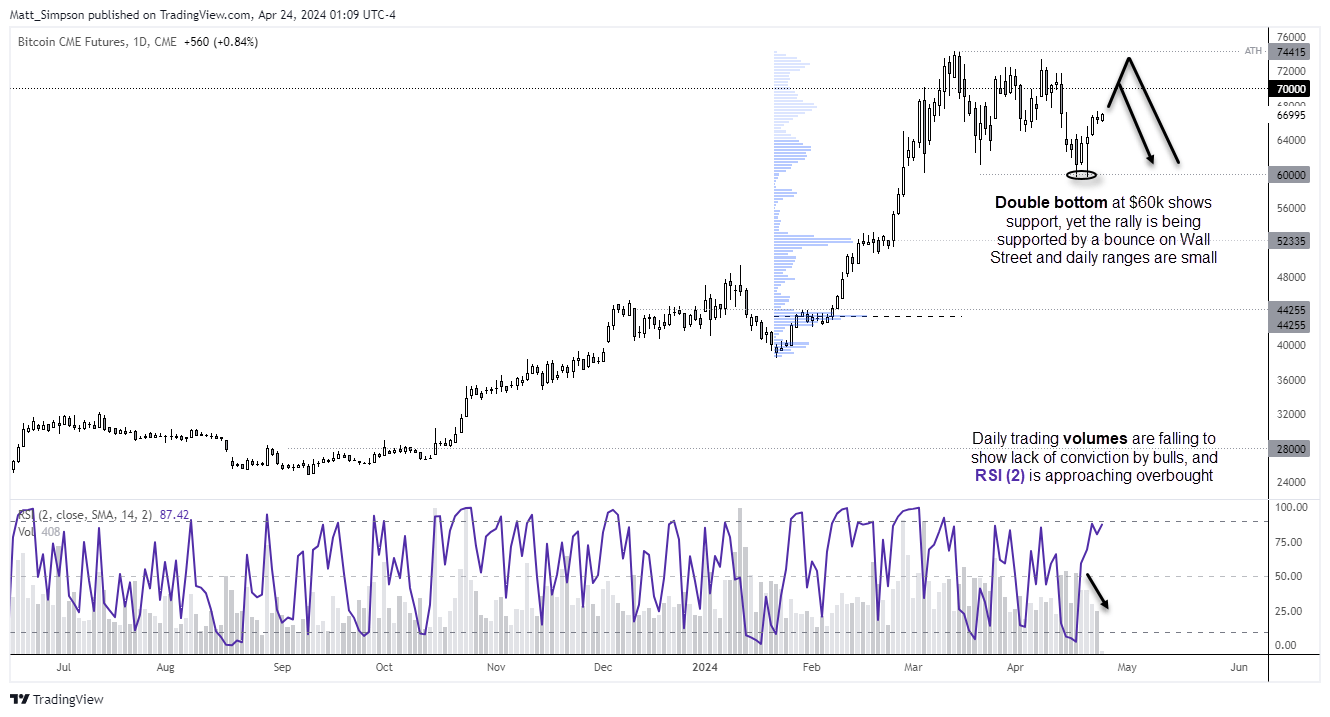
Bitcoin technical analysis (daily chart):
A double bottom has formed at 60k to show bitcoin is not really to roll over yet. Yet the rally this week appears unconvincing with daily trading volume declining whilst prices rise, alongside small daily ranges.
Besides, the bounce is likely being fuelled by the short-covering bounce on Wall street indices, which have rallied for two days from arguably oversold levels. And Wall Street could extend these early gains if big tech earnings outperform expectations and drag bitcoin higher with it.
$70k seems a viable target for bulls over the near term, unless Wall Street truly rips higher, my bias is to fade into resistance levels between $70k and the all-time high in anticipation of another move towards $60k. Whether it can break beneath $69k is likely down to whether the Fed stun markets and start talking about hikes.
-- Written by Matt Simpson
Follow Matt on Twitter @cLeverEdge
How to trade with City Index
You can trade with City Index by following these four easy steps:
-
Open an account, or log in if you’re already a customer
• Open an account in the UK
• Open an account in Australia
• Open an account in Singapore
- Search for the market you want to trade in our award-winning platform
- Choose your position and size, and your stop and limit levels
- Place the trade
Latest market news
Yesterday 01:32 PM
Yesterday 09:35 AM
Yesterday 07:23 AM
Yesterday 04:48 AM
Yesterday 12:17 AM
July 25, 2024 10:39 PM
Latest Trade Ideas articles

Yesterday 09:35 AM

Yesterday 12:17 AM

July 25, 2024 10:39 PM

July 25, 2024 05:30 PM