


- Retail sales fell -3.9% in November (-0.3% expected, down from 1.4%)
- Annual rate of 7.5% is the lowest since 2022
- December was the worst month since August 2020
- Third consecutive December with at -3.3% or greater
- Department stores, clothing and household goods were the worst hit last month
- Western Australia and Victoria saw the fastest contractions in December at -4.7%
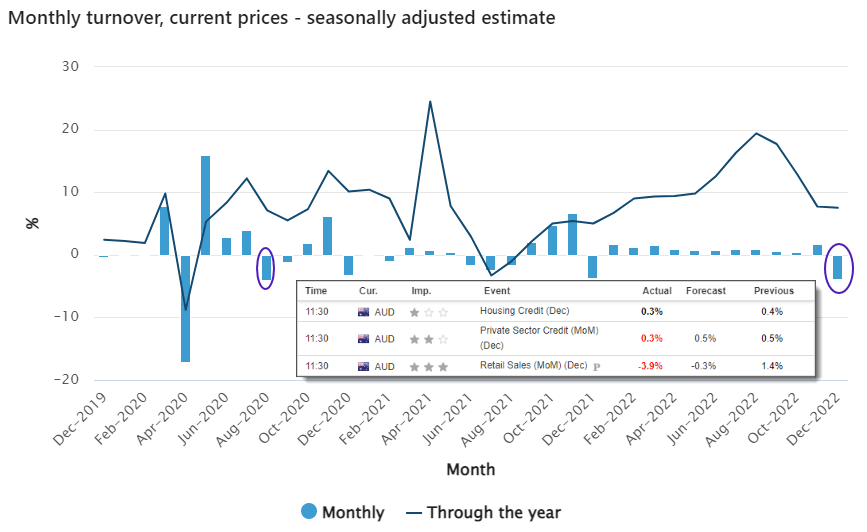
There was a time when it was assumed December would post a strong retail trade numbers as consumers were presumed to splurge their way through the holiday period. But as December’s trade fell -3.9% and much faster than the -0.3% expected, one has to wonder how much of an impact the Black Friday and Cyber Monday sales had on the December figures.
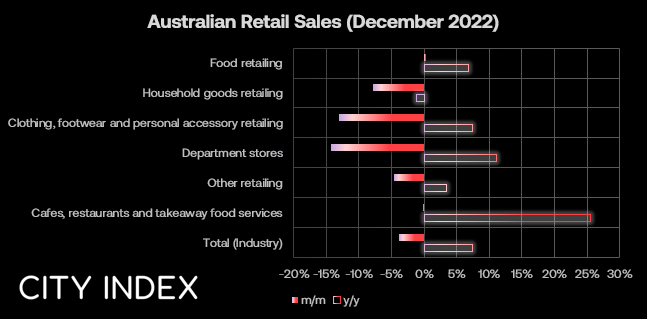
If we look through the sectors we can see that clothing, department stores and household goods saw the largest declines – which is exactly where the best discounts tend to occur over Black Friday sales. Furthermore, not only was December the worst month since August 2020, but it was also the third December in a row of declines over 3.3% (and the worst of the past three Decembers). That’s enough to call a trend.
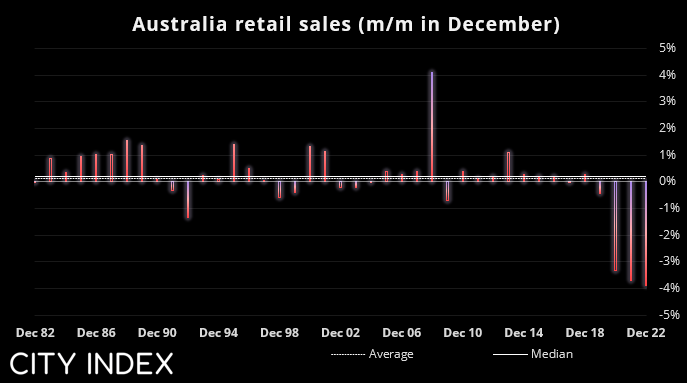
Given the average trade in December over the past 40 years is 0.11% and the median is 0.21%, it would appear that Black Friday and Cyber Monday really is the new Christmas, where retail trade is concerned anyway.
The bigger concern now is whether we continue to see a deterioration of trade in the coming months as the RBA’s hikes really begin to bite into demand. I doubt December’s trade figures is enough to derail another 25bp hike in March, but in all likelihood the RBA do not want to raise rates as much as inflation levels suggest they should. And with another rate hike or two on the horizon, China reopening, iron rallying and a weaker US dollar, it paves the way for AUD to remain supported over the foreseeable future.
AUD/NZD daily chart:
We’ve been waiting for AUD/NZD to retrace from its cycle high to reconsider longs, and it has now once again piqued our interest. Prices found support at the 200-day EMA yesterday, with the 38.2% Fibonacci retracement holding today’s low nearby.
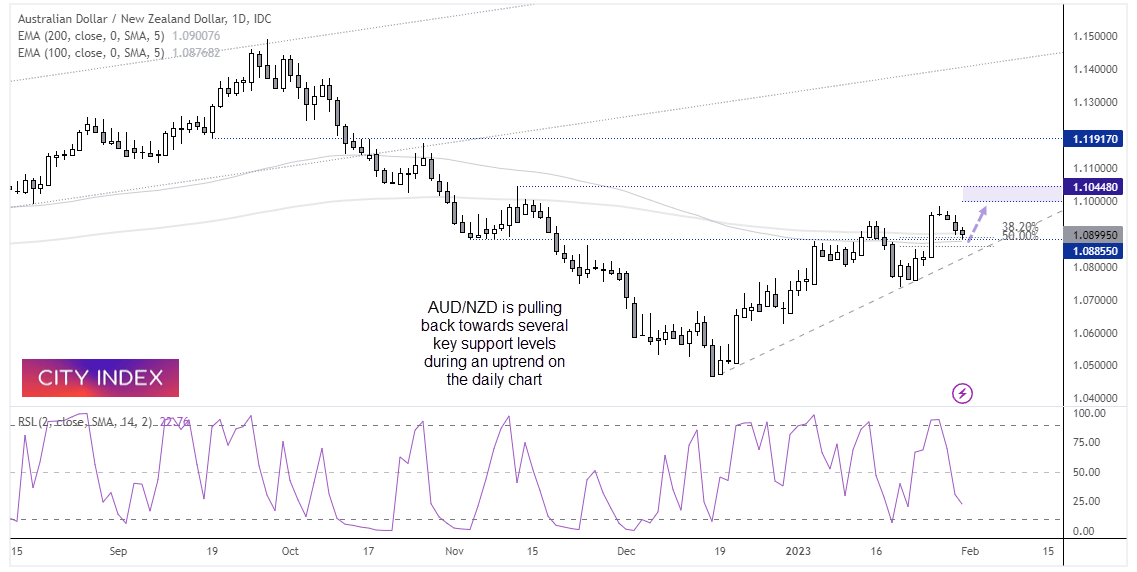
Whilst RSI (2) is not quite overbought, it is not far from it which suggests we could be approaching a cycle low. It is also trading lower for a fourth consecutive day to also suggest mean reversion (higher) may not be too far away.
- Should we see evidence of a swing low on the 1 or 4-hour chart, bulls may be tempted to scale in to a long
- Risk management could then be tightened and new longs added if the momentum begins to turn higher on the daily chart
- 1.1000 is the initial target near last week’s high for bulls to consider, with the potential for a move to 1.1045
Latest market news
Yesterday 01:32 PM
Yesterday 09:35 AM
Yesterday 07:23 AM
Yesterday 04:48 AM
Yesterday 12:17 AM
July 25, 2024 10:39 PM
Latest Trade Ideas articles

Yesterday 09:35 AM

Yesterday 12:17 AM

July 25, 2024 10:39 PM

July 25, 2024 05:30 PM