


Australian employment report highlights
- Unemployment fell to 3.7% (4% prior, below its 12-month MA)
- 116.5k jobs added (78.2k of which were full time)
- AUD/USD broke convincingly above 66c as bears likely trimmed dovish-RBA bets
- AU 3-year bond fell 9bp initially (now down -6bp) and yields rose
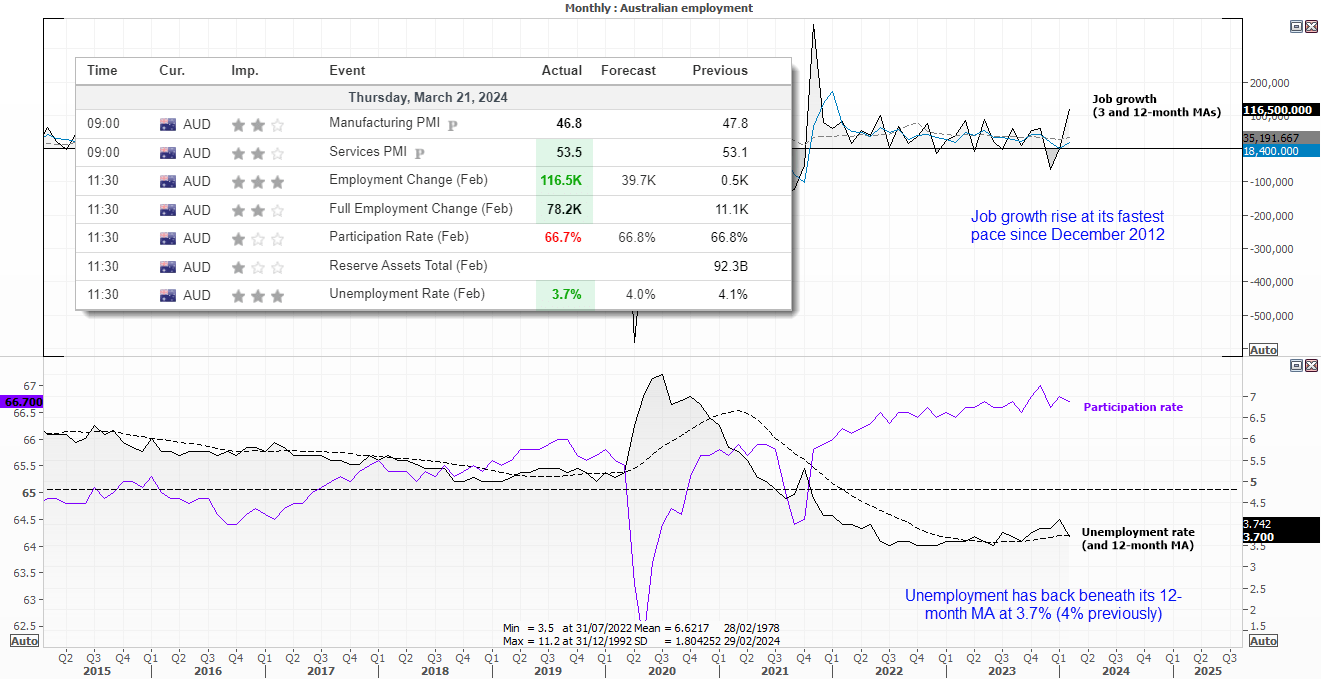
We’re seeing quite a bit of noise in Australia’s employment figures of late, which is making it difficult to interpret the trend. December’s figures revealed a surprise 110.8k slashing of full-tome jobs, before unemployment rose to a 2-year high of 4% in January which increased the odds of RBA easing.
So it did come as a surprise to see job growth rise 116.5k in February and unemployment fall back to 3.7%. The fact that 78.2k full-time jobs were added certainly helps soften the blow from December’s FT culling, but it does bring into question which outlier numbers we should be focussing on; the good or the bad?

Well, given we just had a surprisingly dovish FOMC meeting, today’s strong employment figures have at least seen some AUD/USD bears run for cover. As these numbers aren’t exactly what we’d expect to see from an economy that is due a rate cut any time soon. Services PMI also expanded at a faster pace than expected earlier today. Therefore, I’ll stick with my observation from Tuesday’s RBA meeting’ a 3.5% cash rate is set to stay for some time.
AUD/USD technical analysis:
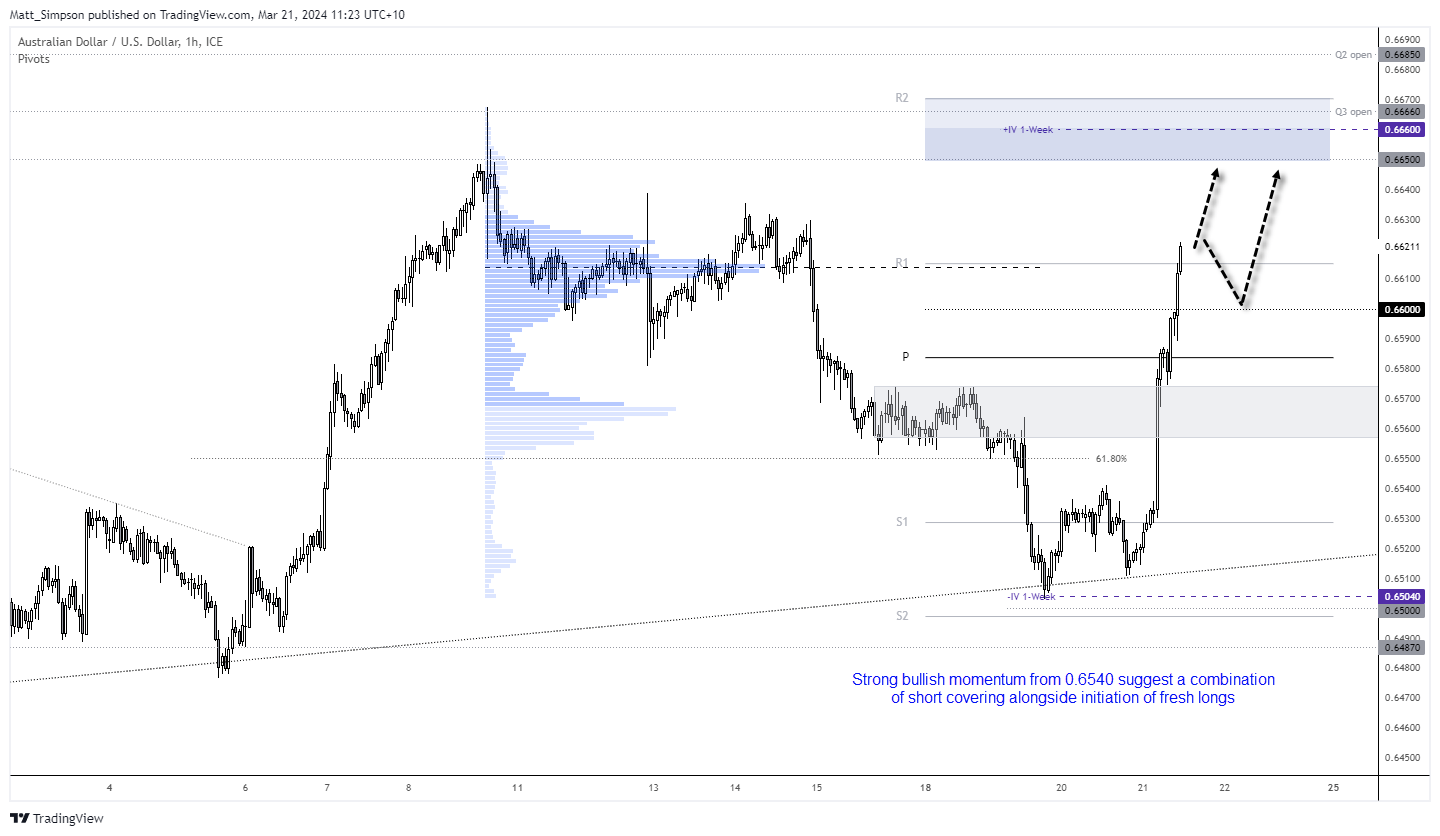
The Australian dollar broke convincingly above 66c following the employment report, and has now fully recovered losses sustained over the past week. The bullish momentum of the past two days likely invalidates any hope of the potential head and shoulders pattern I noted in today’s Asian open report.
The 1-hour chart shows strong bullish momentum heading into 0.6620. It trades above the high-volume node of the prior decline and seemingly on track to head for the 0.6650/60 region. Yet this is not an easy market to be bullish on at these levels, from a reward to risk perspective.
Bulls could either revert to very low times to seek bullish continuation pattern on the assumption AUD/USD will continue higher. Personally, I’d prefer to see a retracement on the 1-hour timeframe before reconsidering its potential for a swing trade long, above or around 66c or the weekly pivot point.
AUD/CHF technical analysis:
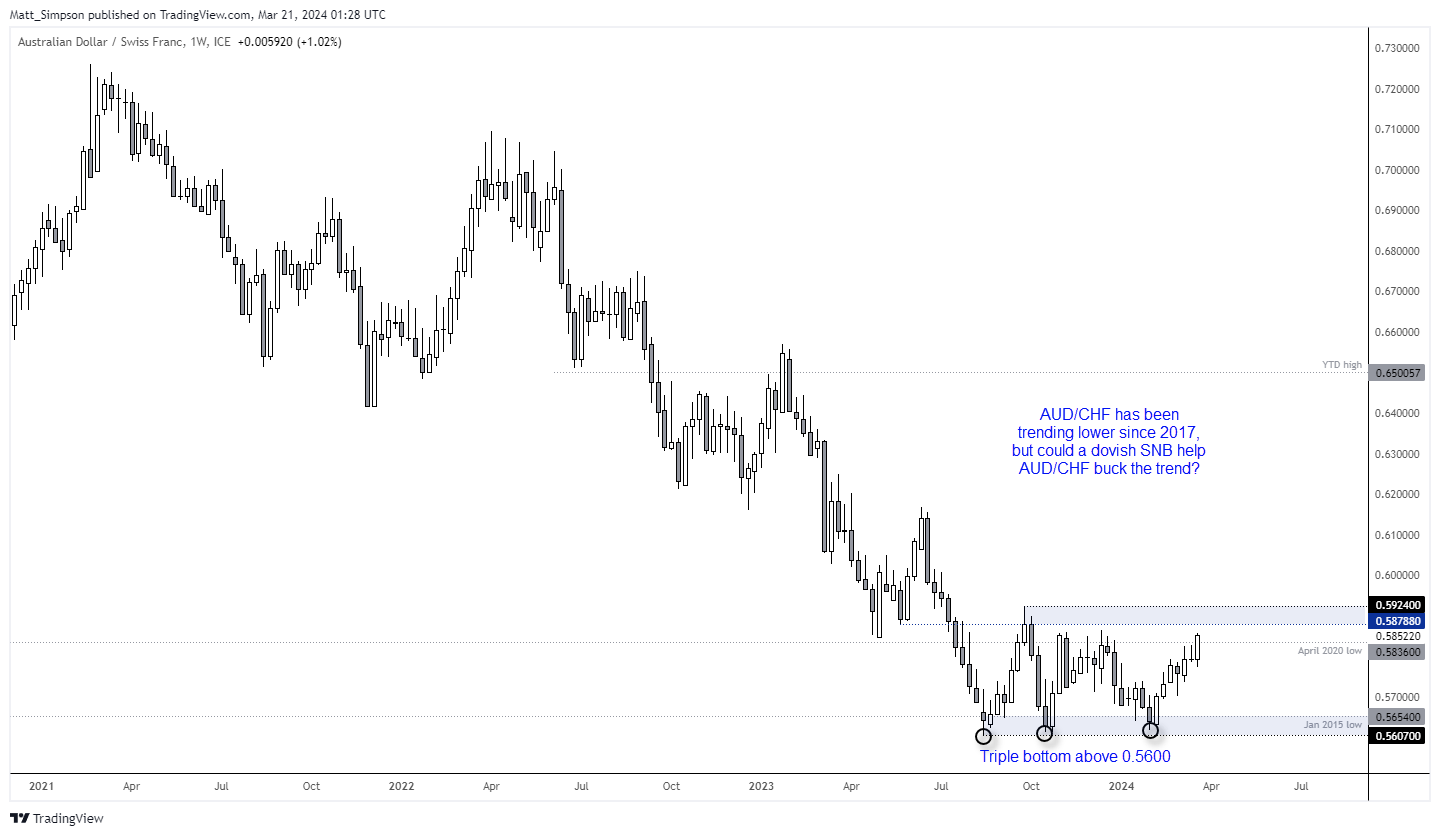
This is not a pair I look at often, but a divergent theme could be building on AUD/CHF to favour long positions over the coming week/s. The cross has been within an established downtrend on the weekly chart since 2017, although a triple bottom formed just above 0.5600 and momentum has pushed prices up to the top of its sideways range.
With the RAB set to hold at a relatively high 4.35%, the SNB are likely to cut and signal easing first. They just so happen to be announcing their monetary policy decision later today.
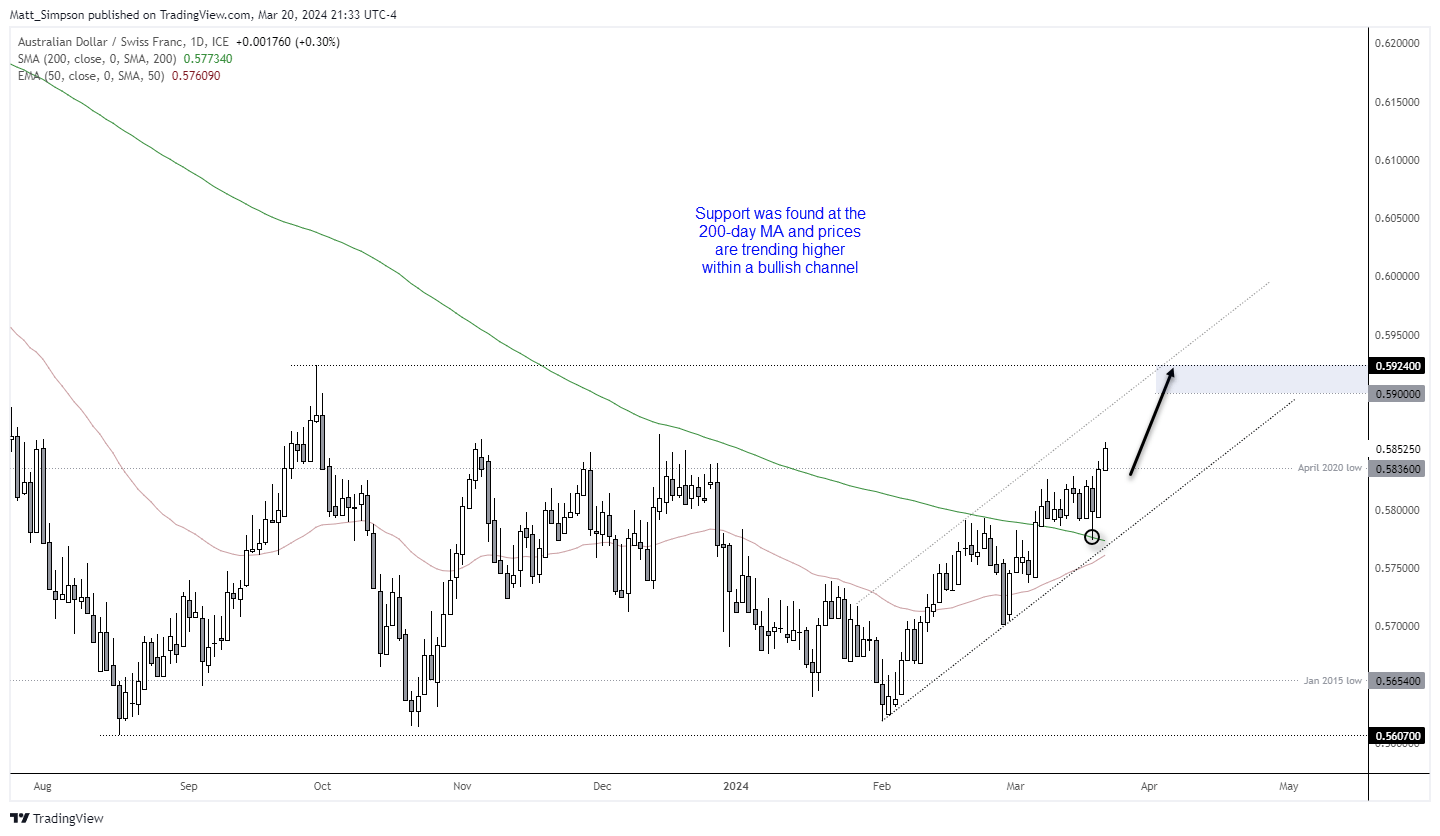
The daily chart shows that a bullish trend has emerged within a rising channel, and support was found at the 200-day MA ahead of a break above the April 2020 low. From here, the bias is to seek dips within the channel and target 0.5900 or the upper trendline – whichever comes first.
-- Written by Matt Simpson
Follow Matt on Twitter @cLeverEdge
How to trade with City Index
You can trade with City Index by following these four easy steps:
-
Open an account, or log in if you’re already a customer
• Open an account in the UK
• Open an account in Australia
• Open an account in Singapore
- Search for the market you want to trade in our award-winning platform
- Choose your position and size, and your stop and limit levels
- Place the trade
Latest market news
Yesterday 01:32 PM
Yesterday 09:35 AM
Yesterday 07:23 AM
Yesterday 04:48 AM
Yesterday 12:17 AM
July 25, 2024 10:39 PM
Latest Trade Ideas articles

Yesterday 09:35 AM

Yesterday 12:17 AM

July 25, 2024 10:39 PM

July 25, 2024 05:30 PM