


With the Fed likely to hike rates to 4.5% by the year end and the RBA trailing with rates of 3.1% over the same period, yield differentials are expected to continue favouring the US dollar over the Australian dollar. The chart above shows that the AU-US 2-year yield differential is trending lower and at an accelerated pace. And, until we see or hear any sort of Fed pivot (which seems unlikely) then the Aussie’s downtrend could remain in place.
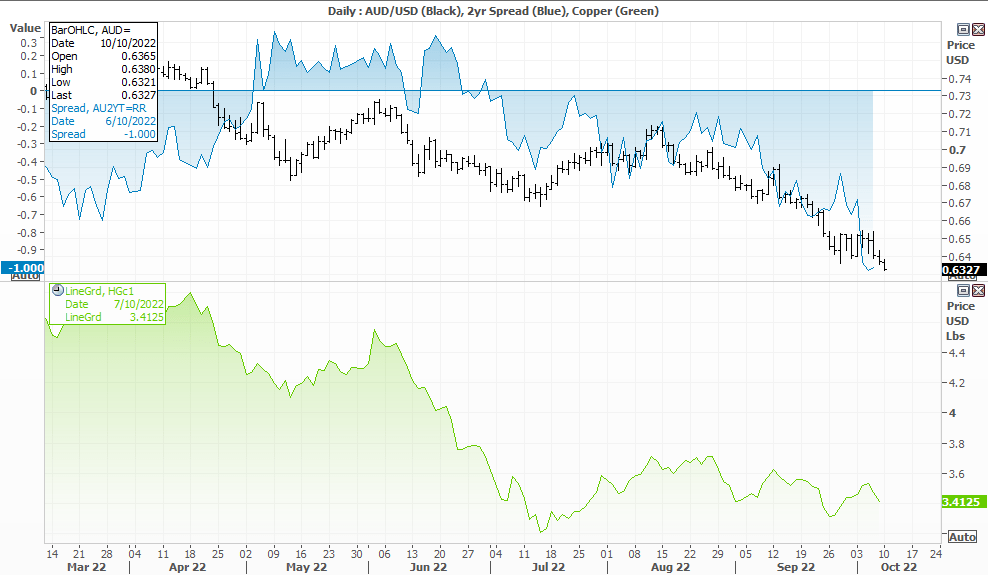
Furthermore, the RBA are closer to a ‘pivot’ than the Fed, having disappointed markets with a ‘dovish hike’ of 25bp last week when the market expected 50bp, and also lowered expectations for the RBA’s terminal rate along the way.
Copper prices also remain in the doldrums as investors retain their bearish view on the global economy, which is another negative for the Aussie.
Implied volatility for AUD/USD continues to rise
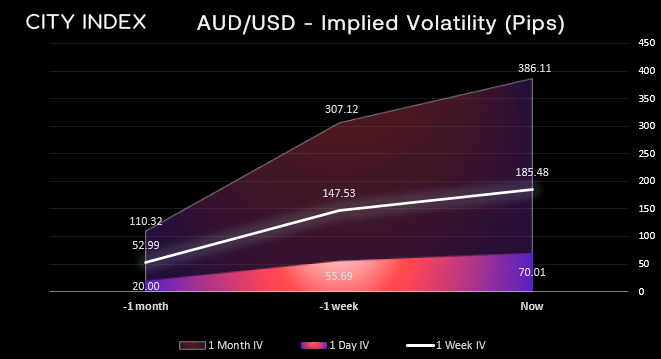
Implied volatility (IV) ha continued to increase for AUD/USD over the past month across the curve. 1 month ago the weekly IV sat around +/- 53 pips and the 1-month was +/- 110 pips. As of a week ago the weekly and monthly IV’s had roughly tripled, and at the tie of writing the 1-week IV is now +/- 185 pips and the 1-month IV is +/- 386 pips.
Using this week’s open price of 0.8365, implied volatility ranges are approximately:
- 1-day: 0.6295 – 0.6550
- 1-week: 0.6180 – 0.6550
- 1-month: 0.5980 – 0.6750
Read our guide on the Australian Dollar
AUD/USD daily chart:
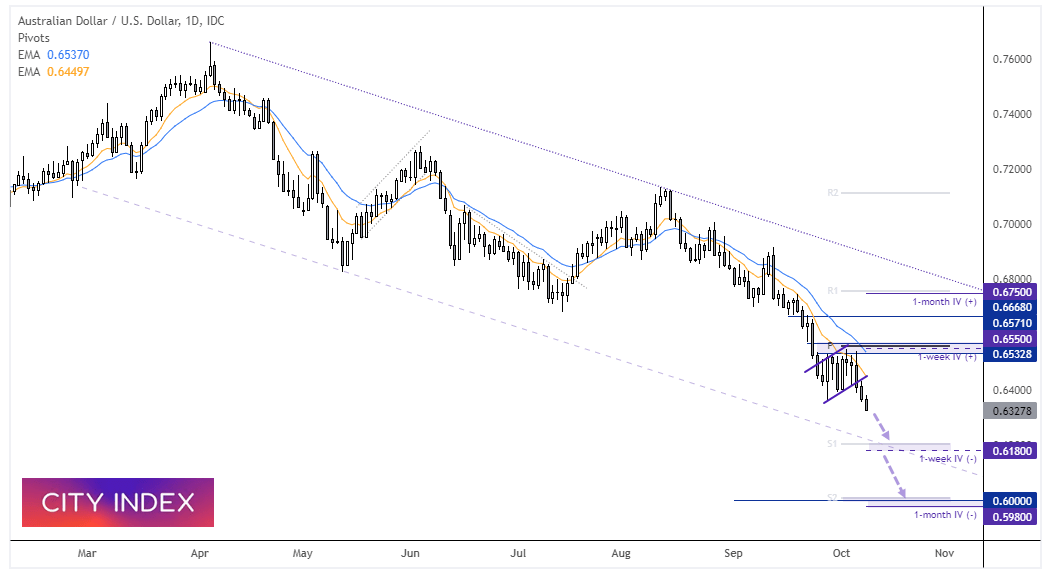
AUD/USD has broken out of a bear flag pattern which projects an approximate target around 0.6000. Incidentally this also lands near the psychological round number and the 1-month negative IV target. Notice that the 10-day EMA has capped as resistance and momentum is now pointing lower, so our bias remains bearish beneath this level. Bears could enter live at market with a stop above the 10-day EMA and initially target the monthly S1 pivot (near the 1-week IV target of 0.6180 and the lower trendline). A break beneath this level then brings the lower target into focus around 60c.
How to trade with City Index
You can easily trade with City Index by using these four easy steps:
-
Open an account, or log in if you’re already a customer
• Open an account in the UK
• Open an account in Australia
• Open an account in Singapore
- Search for the company you want to trade in our award-winning platform
- Choose your position and size, and your stop and limit levels
- Place the trade
Latest market news
Yesterday 01:32 PM
Yesterday 09:35 AM
Yesterday 07:23 AM
Yesterday 04:48 AM
Yesterday 12:17 AM
July 25, 2024 10:39 PM
Latest Technical Analysis articles

July 25, 2024 03:59 PM

July 24, 2024 07:26 PM

July 24, 2024 09:55 AM

July 23, 2024 11:58 AM