


November 3, 2022 7:40 PM

Amazon’s stock price has fallen for the seventh consecutive day. On Tuesday, October 25th, the stock closed at 120.60. Today’s intra-day low is 89.02, a fall of over 26% in just 7 days. AMZN released its earnings on October 27th. On that day, the stock price closed at 110.96. The next day, price gapped lower and opened at 97.91! Amazon’s revenues for Q2 2022 were $127.10 billion vs $127.46 estimated. But that’s why the stock has been falling so much. Amazon also guided its revenues lower for Q4, now expecting between $140 billion to $148 billion vs analyst expectations of $155 billion. Amazon’s CFO indicated that the company is cutting its capital expenditures budget for this year by one-third. He also said that the company is pausing hiring in certain businesses and winding down products and services where resources can be better spent elsewhere. Analysts warned that this could be the slowest holiday sales growth on record and that costs have now risen at a faster pace than revenue for five consecutive quarters.
The panel at the bottom of the chart below shows the correlation coefficient between AMZN and the NASDAQ 100. For much of the year, the 2 assets have had a strong positive correlation, which is indicated by readings above +0.80. However, notice that when AMZN released earnings on October 27th, the correlation fell dramatically, indicating that the price of AMZN fell much faster than that of the NASDAQ 100.
Trade AMZN now: Login or Open a new account!
• Open an account in the UK
• Open an account in Australia
• Open an account in Singapore
The price fall for AMZN is currently supported by the 127.2% Fibonacci extension from the lows of June 14th to the highs of August 16th, at 89.15. Given the fast rate of decent of the stock price, the RSI has moved into oversold territory at 23.76. This indicates that price may be ready for a relief rally as price may have fallen too far, too quick.
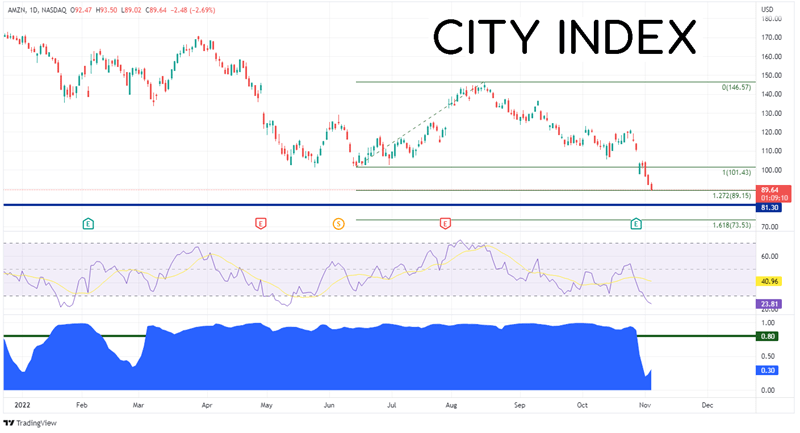
Source: Tradingview, Stone X
If AMZN’s stock price is going to continue lower, it must first pass through a confluence of support at today’s low, the 127.2% Fibonacci extension, and a downward sloping trendline dating to August 9th. The next support level is the low from March 2020 at 81.30. Below there, price can fall to the 161.8% Fibonacci extension from the above-mentioned timeframe at 73.53. However, notice that the RSI on the 240-minute chart is even more oversold than that of the daily chart, at 19.61. This is a strong indication that the stock may be ready for a correction. First resistance is at the highs from October 31st at 104.84. Above there, price can move swiftly to fill the gap at 109.77, then the highs of October 25th at 120.98.
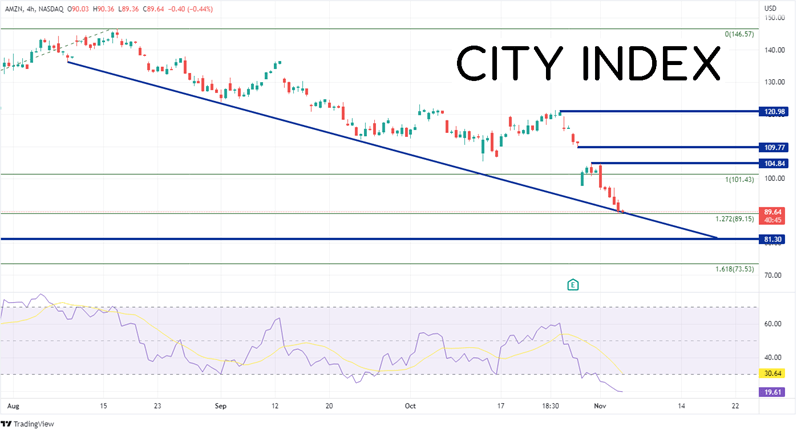
Source: Tradingview, Stone X
The price of Amazon stock is down 25% over the last 7 trading days. Earnings and guidance are mostly to blame. However, technical indicators on the daily and 240-minute timeframe look like the stock price may be ready to bounce. If it does bounce, look at the resistance levels to get a better idea of a near-term target.
Learn more about equity trading opportunities.
Latest market news
Yesterday 01:32 PM
Yesterday 09:35 AM
Yesterday 07:23 AM
Yesterday 04:48 AM
Yesterday 12:17 AM
July 25, 2024 10:39 PM
Latest Trade Ideas articles

Yesterday 09:35 AM

Yesterday 12:17 AM

July 25, 2024 10:39 PM

July 25, 2024 05:30 PM