


There’s a huge range of top trading indicators available to use on charts – so which technical indicators should you focus on?
What are trading indicators?
Trading indicators – also known as technical indicators – are tools that you can use to get a better understanding of a market’s price action on its chart. They work by performing calculations on recent or current price movements.
The theory behind the top trading indicators is that you can gain crucial insight into where a market might be headed next by taking a closer look at where it has been. But each tool achieves this in a different way and is designed for different conditions or strategies. So choosing the right kit for you is a key part of trading successfully.
Learn more about technical analysis.
Leading vs lagging indicators
There are various categorisations of indicators, but the most common is to split them into two variants: leading and lagging.
- Leading indicators look forwards, predicting future movements and changing quickly as price action develops
- Lagging indicators look backwards, taking lots of past price action into account. This makes them slower to update
Why use trading indicators?
There are a number of ways that trading indicators can help you perform technical analysis – and find successful opportunities. Here’s a quick overview of the common uses of indicators:
|
Use |
Info |
Indicator(s) |
|
Get a wider view |
Lots of indicators use data from multiple sessions to give you a better idea of what’s happening now. The length of each session depends on the timeframe of your chart, from one minute up to a month or year. |
|
|
Measure volatility |
Volatility is how much a market is moving – highly volatile markets present more opportunities, but also greater risk. |
|
|
Find support and resistance levels |
These are areas on a chart where price tends to reverse and are useful for entering and exiting positions. |
|
|
Find and confirm breakouts |
When a support or resistance level is broken, the market can break out into a new trend. |
|
|
Measure trends and momentum |
Some indicators help identify whether a trend still has strength, or whether a reversal could be imminent. |
|
|
Identify overbought and oversold markets |
If an uptrend runs too hot, the market becomes overbought and should correct downwards. If a downtrend runs too hot, it becomes oversold.
|
|
|
Look for divergences |
These occur when a market is moving counterintuitively to its indicator – for example, is gaining when the indicator says it should be losing. They can signal impending reversals.
|
Most traders won’t use a single indicator in isolation: instead, they’ll use a few. That way, you can confirm each reading before you open a position.
Start trading with technical indicators today
Follow these steps to start using the indicators covered below with City Index today:
- Open your City Index account, or log in if you already have one
- Add some funds
- Find the indicators list on the chart of your chosen market, and choose your tools
- Open your buy or sell position
Alternatively, you can practise trading with a cost-free City Index demo account. You’ll get full access to our platform, preloaded with virtual funds. So, you can test out your trading strategy with zero risk.
10 top trading indicators
- Moving averages
- EMAs
- MACD
- RSI
- Stochastic oscillator
- Bollinger bands
- Pivot points
- Fibonacci retracement
- ATR
- ADX
1. Moving averages
Moving averages (MAs) are some of the simplest trading indicators to use and understand. They look back at a market’s price over a set number of sessions and give you its average. As price moves, the MA will take the new action into account and update accordingly – hence the name, moving average.
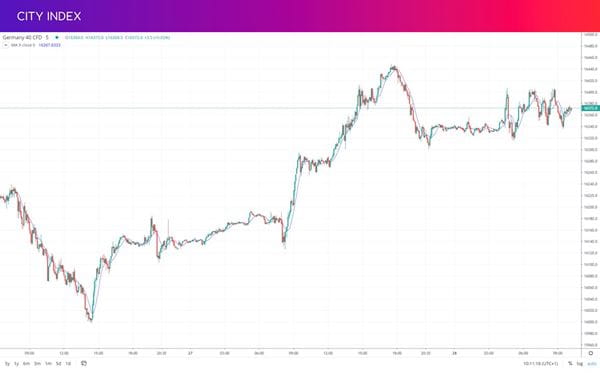
The chief use of an MA is to smooth out the short-term volatility on a market’s chart and see the broader trend. How broad is up to you: the more sessions you include in the calculation, the smoother the MA will be.
However, you can also use MAs to generate signals – trade ideas that you can execute. One method is to add two averages to a chart, one long term and one short. If the short-term MA crosses above the long term one, it is a buying opportunity; if it crosses below it is a selling opportunity.
2. EMAs
Exponential moving averages (EMAs) are a slightly more complex version of the moving average we’ve already covered. Instead of a straight average of price over a set number of sessions, the EMA calculation places more weight on recent action – making them slightly less lagging than simple MAs (sometimes called SMAs).
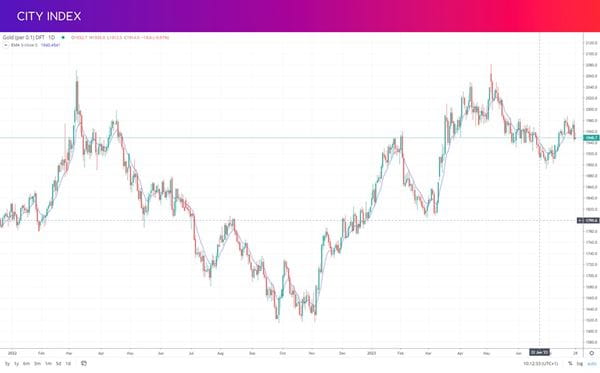
As with MAs, you can use EMA crosses to generate signals from a short-term average (say, 12 or 26 days) and a long-term one (50 or 200 days is common).
If a market is trading above its EMA, it is seen as a sign of bullish conditions. If it is below, on the other hand, it is a bearish sign. EMAs can also act as support or resistance levels.
3. MACD
Moving average convergence divergence (MACD) is an example of how an indicator might use price data to give you a deeper look at a market. It is an oscillator, which means it appears below a market’s chart – unlike the MA and EMA, which are overlaid onto the action.
The MACD consists of two lines, calculated using two moving averages. One is an EMA (usually 26 periods) and the other is an SMA (usually 12 periods).
- The MACD line is the EMA minus the SMA
- The signal line is a 9-session SMA of the MACD line
You’ll usually also see a histogram, which measures the distance between the two.
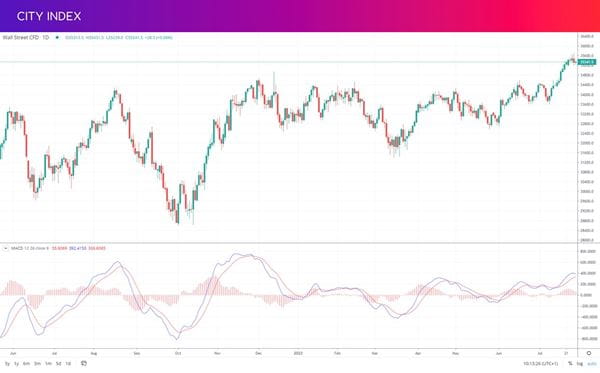
MACD is often used to measure momentum. When the MACD line is far above the signal line, it is seen as a sign of strong upward momentum, when it is far below it is a sign of downward momentum. You can also look for crosses between the two lines, when a new trend may be forming.
4. RSI
The relative strength index (RSI) is another oscillator – but is used to identify overbought and oversold conditions. It measures the gains a market made in sessions where it closed up and compares it to the losses made when it closed down. It then plots that calculation as a reading between 0-100.
- A reading above 70 is a sign that a market is overbought
- Below 30 and it may be oversold
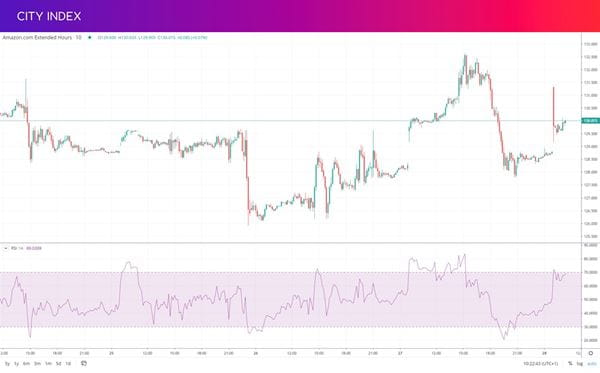
However, it isn’t usually a good idea to trade based on the RSI alone – markets can be overbought or sold for prolonged periods without reversing.
You can also use the RSI to look for divergences: when the RSI is peaking or falling but the market is moving in the opposite direction.
5. Stochastic oscillator
The stochastic oscillator is often compared to the RSI, because both are oscillators used to measure momentum. However, they work in different ways.
The stochastic compares a market’s most recent close to its previous highs and lows, telling you where it currently sits within that range. Like the RSI, it plots this information as a line that moves between 0 and 100. However, the stochastic also comes with a signal line – a moving average of the main line.
- When the stochastic is above 80 the market may be overbought
- When it is below 20 it may be oversold
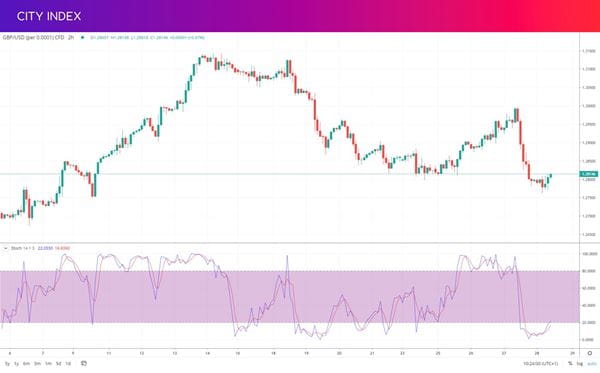
Traders often use the RSI in faster-moving markets, and the stochastic in slower ones.
6. Bollinger bands
Next up in our list we have another overlay. And it’s one of the best-known trading indicators: Bollinger bands.
Bollinger bands look similar to moving averages, appearing as a series of lines on a chart. But instead of averaging out price movements, they show you how volatile a market currently is. They do this using a moving average, with two lines plotted on either side of it – each two standard deviations above or below the MA.
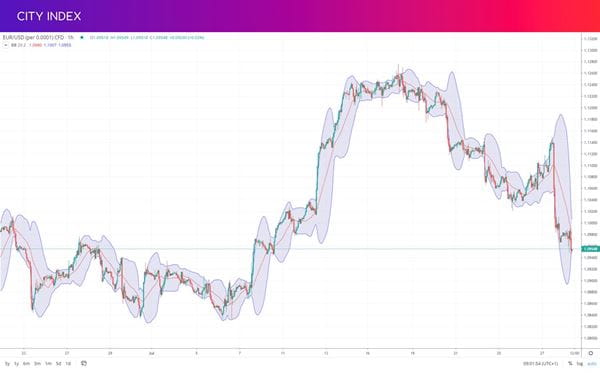
Standard deviation is a measure of how much a series varies from its norm. So when the Bollinger bands are far apart, it indicates high volatility. When markets are calm, the bands will be close together.
Bollinger bands are also used to generate overbought and oversold signals. When a market continually tests the upper band, it is seen as potentially overbought – if it tests the lower one, it may be oversold.
7. Pivot points
Pivot points are used to identify where future support and resistance levels might be. They’re calculated using price data from the previous session which is overlaid onto a market’s chart.
When you select the pivot points indicator, you’ll see a series of horizontal lines appear on your chart. The middle line is labelled P, with R1, R2, R3, R4 and R5 above it and S1, S2, S3, S4 and S5 below.
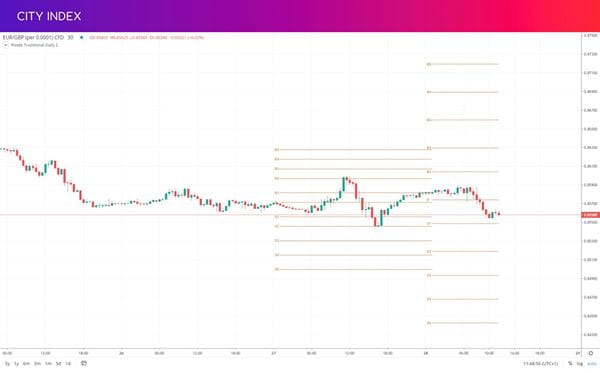
P is an average of the previous session’s highest, lowest and closing prices. If the market is trading above P, it is generally a sign of bullish conditions. If it is below, it is bearish.
The S and R lines, meanwhile, are potential future support and resistance levels. These are calculated using a series of different formulas.
8. Fibonacci retracement
Like pivot points, the Fibonacci retracement tool is used to identify upcoming support or resistance levels where momentum might reverse. But instead of using the previous session’s data, they’re calculated based on a recent significant move up or down.
Fibonacci retracements take the ratios from Fibonacci theory and applies them to a recent major move. The idea is that the retracement of that move will then often reverse at one of these levels – making them useful areas to open or close positions.
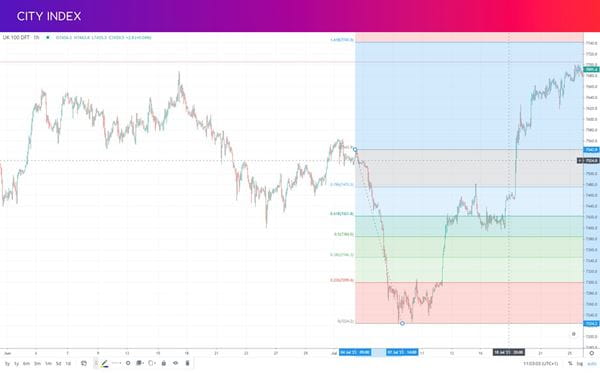
Strickly speaking, Fibonacci retracement isn’t a trading indicator – it’s a drawing tool. To use it, you select it from the drawing tools menu on the City Index platform, then select the beginning and end of the move you want to trade.
It’s worth noting that there’s no guarantee that a market will reverse at a Fib level or a pivot point. They’re best used alongside other reversal signals, such as candlestick patterns.
9. ATR
The average true range indicator tells you how much a market might move in the current session. It does so by working out your market’s ‘true range’ – the absolute highest value from these three calculations:
- Current high – previous close
- Current low – previous close
- Current high – current low
It then makes a moving average of these calculations over a set number of sessions (usually 14, but you can adjust as you see fit). If the ATR is rising, it means a market is more volatile, if it falls then the market is consolidating.
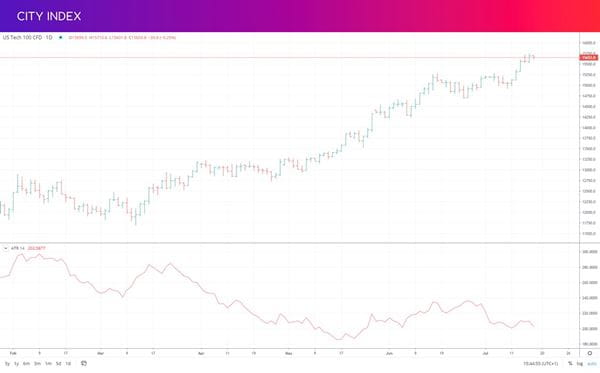
Knowing how much a market might move in a session has a number of uses. For example, it helps you plan realistic profit targets: if you’re hoping for 500 points of profit from an asset that’s only moving 10 points a day on average, then you might need to keep your position open for a long time.
10. ADX
Finally, we have the average directional index (ADX), a tool that’s used chiefly to measure the strength of ongoing trends.
Like the ATR, the ADX indicator plots a moving average that appears underneath a market’s chart. However, in this instance, it is an average of price expansion – telling you whether range is increasing or decreasing.
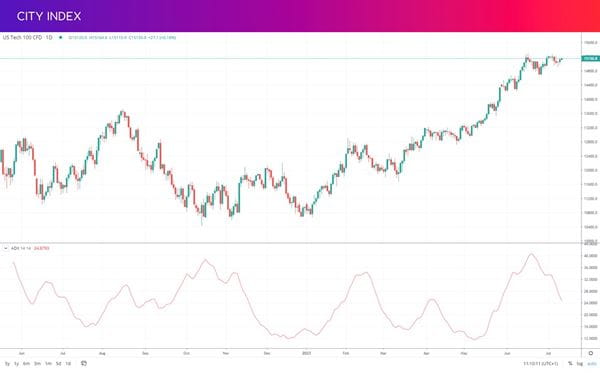
Unlike other momentum indicators like the RSI or stochastic, it doesn’t generate overbought or oversold signals. Instead, if the ATR is above 25 it indicates a strong trend, and if it is below then it means a weak or non-existent trend.
Latest market news
April 25, 2024 03:09 PM
April 25, 2024 03:00 PM
April 25, 2024 01:12 PM
Latest Technical Analysis articles

April 24, 2024 02:03 AM

April 22, 2024 04:33 PM

April 21, 2024 11:20 PM

April 15, 2024 07:13 PM