


The ADX indicator is a useful tool for any technical trader, helping to mitigate the risk of losing out on a faltering trend. Learn how to trade with the average directional index here.
- What is the ADX indicator?
- How does the average directional index work?
- How to use the ADX indicator in trading
- How reliable is the ADX indicator?
- Calculating the average directional index
What is the ADX indicator?
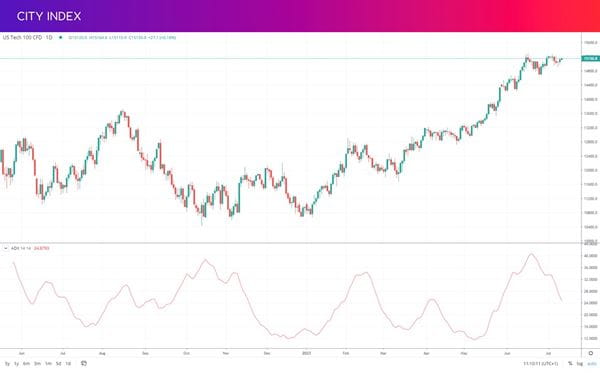
The ADX indicator is a technical analysis tool that helps traders gauge the strength of trends. It appears underneath trading charts as an oscillator, with a reading above 25 indicating a strong trend – while 25 or below means a weak or non-existent one.
Trend trading remains one of the most popular strategies, despite the fact that markets tend to only trend around 30% of the time. That makes identifying strong trends a key skill for successful trading – and the ADX can help you do just that.
It was invented in 1978 by J. Welles Wilder for use in commodity trading. Today, traders of most asset classes – including forex, indices and stocks – find the indicator useful.
How does the average directional index work?
The average directional index works using a moving average of price range expansion. If a market’s range increases over time, then the ADX will go up – if not, it will go down. The ADX line is then plotted on a chart from 1-100:
- 0-25 means that a market has a weak trend – or no trend whatsoever
- 25-50 means that a market is strongly trending
- Anything above 50 means that a market is extremely trending
Note that unlike other oscillators – for example, the stochastic – the ADX line doesn’t tell you whether a market has bearish or bullish momentum. It can only indicate whether a trend is strong or not. If a market is falling but the ADX is rising, it means that the bearish trend has a strong basis behind it.
However, as well as the ADX line, you may see two other lines on the average directional index: the +DI and -DI. These can be used to identify direction, chiefly by using crosses.
- If the +DI line crosses above the -DI line and the ADX line is above 20, it is a sign of a bullish trend
- If the +DI line crosses below the -DI line and the ADX is above 20, it is a sign of a bearish trend
Not every trader uses the DI lines, many stick to using the ADX to measure trend strength.
How to use the ADX indicator in trading
The most common use of the ADX indicator in trading is to measure the momentum behind an ongoing trend, to help decide whether to take a position – or possibly whether to exit an existing trade.
It’s worth highlighting that a falling ADX line doesn’t necessarily mean a trend is about to reverse, and traders rarely use the ADX to find upcoming reversals. Instead, it indicates that momentum may be weakening. This may be a sign that a market is about to consolidate or become range bound.
A common way to utilise the ADX is as part of a breakout trading strategy. Once you’ve found a new breakout, you can employ the ADX indicator to help confirm that a new trend is in fact underway. If the ADX is reading below 25, you might want to hold off before opening a new position.
The ADX can also provide a bit of extra confidence to let profits run when trend trading. By keeping an eye on the ADX indicator, you can help ensure that your trend still has momentum, so you don’t need to take your profits yet. A sustained trend might not see the ADX remain above 25, but instead oscillate with multiple peaks.
Start using the ADX in trading
Follow these steps to start using the ADX indicator with City Index today:
- Open your City Index account, or log in if you already have one
- Add some funds
- Select the ‘ADX indicator’ on the chart of your chosen market
- Open your buy or sell position
Alternatively, you can practise trading with a cost-free City Index demo account. You’ll get full access to our platform, preloaded with virtual funds. So, you can test out your trading strategy with zero risk.
How reliable is the ADX indicator?
The ADX indicator can be a useful tool when trading, but it certainly isn’t fool proof. The +DI and -DI lines in particular can cross often, giving off false signals especially when markets aren’t strongly trending.
The ADX line has also been known to stay below 25 even when a market is clearly strongly trending, and spike on a rangebound chart. Because of this, most traders won’t use the indicator in isolation – instead, they’ll choose a mix of complementary tools.
Comprehensive risk management is also imperative, using stop losses and planning your trades to ensure losses are kept in check.
How to calculate the ADX indicator
To calculate the ADX indicator you need to follow a series of complicated steps which we outline below. However, you don’t need to calculate the indicator manually – the charts on the City Index trading platform will do it for you.
If you want to calculate ADX yourself, though, the first step is to find your chosen market’s Up Move and Down Move:
- Up Move = today’s high – yesterday’s high
- Down Move = yesterday’s low – today’s low
You can then use this data to calculate the directional movement (+DM and -DM):
- If Up Move is greater than Down Move and above 0, then +DM is the same as Up Move. Otherwise, it is 0
- If Down Move is greater than Up Move and above 0, then -DM is the same as Down Move. Otherwise, it is 0
Next, you can use +DM and -DM to calculate the directional index lines (+DI and -DI):
- +DI is 100 times the smoothed moving average of +DM / average true range
- -DI is 100 times the smoothed moving average of -DM / average true range
A smoothed moving average works like an exponential moving average, but with more sessions taken into account. How many sessions is up to you, but 14 is the standard.
Finally, it’s time to calculate the ADX line:
- Average directional index = 100 times the smoothed moving average of (+DI – -DI) / (+DI – -DI)
Best ADX indicator settings
The best ADX indicator settings depend on how you plan on using the tool. It is fairly customisable – you can change the smoothed moving average to a different number of sessions, or change it to a different moving average entirely.
The standard setting for the ADX indicator, though is to use 14 sessions for the moving average and the DI lines.
Latest market news
Yesterday 06:37 AM
April 26, 2024 01:25 PM
April 26, 2024 11:40 AM
April 25, 2024 03:09 PM
Latest Financial market insight articles

March 26, 2024 04:11 AM

November 13, 2023 11:05 AM

October 25, 2023 01:45 PM

October 25, 2023 07:48 AM