


MACD is an acronym for Moving Average Convergence/Divergence, and it is one of the most popular technical indicators among traders. Its relative ease of use and popularity make the MACD fundamental knowledge for traders looking to incorporate technical analysis into their trading strategy.
What is Moving Average Convergence/Divergence (MACD)?
Moving Average Convergence/Divergence, or MACD for short, is a technical indicator used by traders to identify whether a trend is bullish or bearish. That is, regardless of current volatility, the MACD can help reveal an overarching trend in price action that is either rising (bullish) or falling (bearish).
How does MACD work?
MACD works by tracking three moving averages (MAs) of a security’s price. The indicator uses two simple moving averages (SMAs) and one exponential moving average (EMA) to compare long and short-term price trends.
The MACD can reveal changes in the security’s overall price action depending on the plot of its moving averages. A reversal or reinforcement of the current trend is predicted by the indicator depending on whether the moving averages converge or diverge, hence the indicator’s name.
Most charting software will automatically set two moving averages for MACD comprised of 12 and 26-period moving averages (MAs). The first MA represents the past 12 bars on the price action chart and is calculated as a simple moving average. The second represents the past 26 bars and is represented as an exponential moving average, giving more weight to the most recent bars.
These two MAs are represented on the MACD chart by a single line, combined by subtracting the 26-period EMA from the 12-period SMA. It is referred to as the MACD line.
A second line is calculated by taking the difference of the past nine periods of the MACD line. It’s known as the signal line.
These two moving averages represent ‘fast’ and ‘slow’ price trends. The MACD line will change values quicker than the signal line because it is more reactive to price changes than its smoothed-out average partner, the signal line.
A histogram is displayed underneath the two lines which plots the difference between the MACD line and the signal line. It functions as a graphical representation of the difference between the two lines and can help visualize the value and positioning of both lines.
How to read a MACD
To read a MACD indicator, you should focus on the position of the MACD and signal lines and the difference between them. Specifically, you are looking for divergences and convergences between the two lines.
In the image below, you can identify the MACD line (blue), the signal line (red) and the histogram representing the difference between the two. Also note the zero line – which the histogram is centred around.
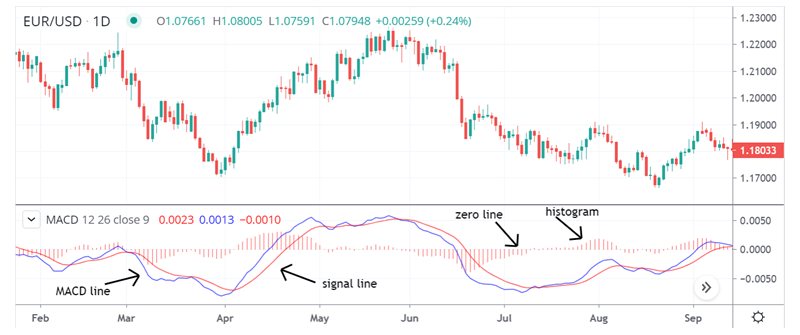
When the two lines converge, the histogram gets smaller as the faster-reacting MACD line stays near the slower-reacting signal line. This indicates a slowdown of the ongoing trend and possible reversal. In the image below, we’ve identified a moment in orange where the lines converge as price action changes.
As the two lines diverge, the histogram bars grow larger indicating the MACD line is changing values faster than the signal line. This indicates increasing momentum in the current trend. In the same image, we’ve highlighted a moment in green where the histogram bars grow larger while the price action trend continues in the same direction.
How to use MACD indicator
You can easily access the MACD indicator with City Index’s Web Trader or mobile trading platform. To use the MACD indicator in your own trading:
- Log in to your City Index account, or quickly apply for an account if you’re not yet a member
- Open the MACD indicator on your chart
- Adjust the values of the moving averages (although the default 12,26,9 work well for most traders)
- Identify long and short opportunities using the MACD in conjunction with other technical indicators and fundamental strategies
- Place your trade based on the bullish and bearish signals provided
Alternatively, you can open a City Index demo account to practice trading with the MACD. And learn more about our account offerings here.
MACD trading strategies
There are many different strategies you can incorporate the MACD indicator into. Here we cover three of the most common, divergence, crossovers and zero line crossovers, and provide examples of all three.
MACD divergence strategy
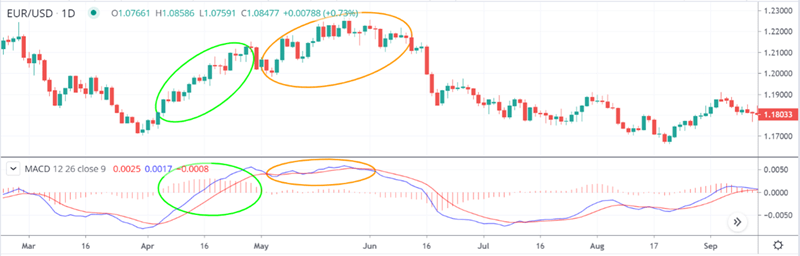
The MACD divergence strategy refers to when two factors on a price chart begin moving independently from one another, like price action and momentum. Divergence typically indicates that momentum is slowing down, even if the price action continues moving in the same direction.
In the chart below, an example of bullish divergence is highlighted. Notice the price action continues to make lower lows while the MACD histogram makes higher lows. This might be an indication to close out any short positions or take a long position on EUR/USD.
Learn more about trading bearish and bullish divergences.
MACD crossover strategy
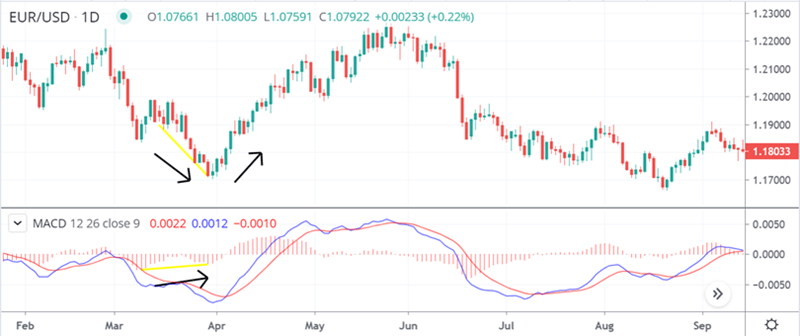
The MACD crossover strategy focuses on when the MACD line and signal line cross one another.
- When the MACD line crosses above the signal line, a bullish signal is generated
- When the MACD line crosses below the signal line, it’s considered a bearish signal
This is because the MACD line is more reactive than its smoothed out, 9-period average represented by the signal line. So, the direction the MACD line moves relative to its lagging average value gives traders an indication of whether the market is moving in a bearish or bullish trend.
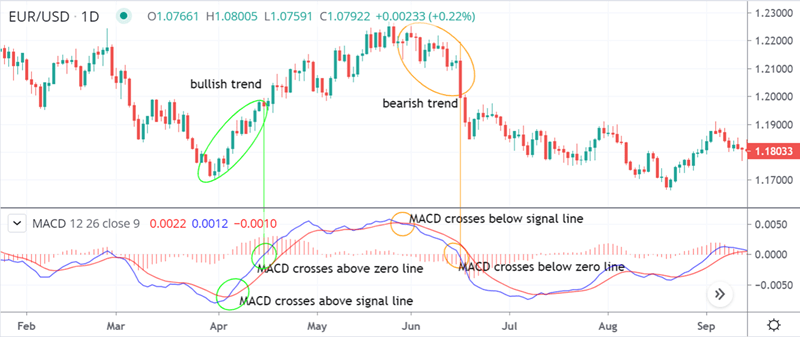
Examine the EUR/USD chart below and pay close attention to the MACD indicator at the bottom. Notice each time the (blue) MACD line crosses with the (red) signal line and the related change in price action.
Moving average crossovers are a popular indicator among traders for their simplicity and ease of use, learn more about trading crossovers.
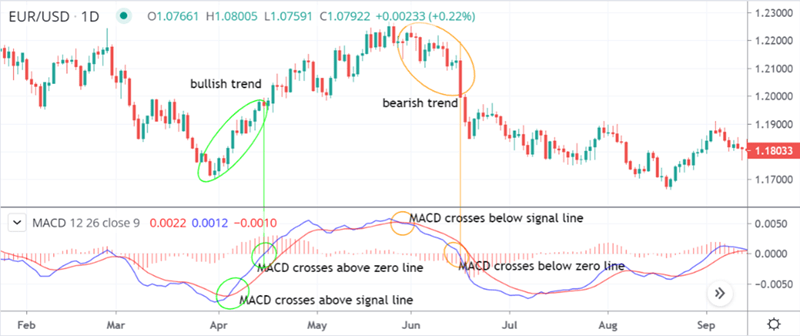
MACD zero line crossover strategy
The zero line crossover is perhaps the most simple MACD trading strategy. It involves watching for when the MACD line crosses over the zero line at the centre of the histogram. If the MACD line moves from underneath to above the zero line, a bullish trend is indicated. A bearish trend is indicated when the MACD moves below the zero line. Looking at the chart again, it’s clear the zero line crossover lags behind the actual price trend. In this way, it may best be used to confirm other signals of a trend.
MACD vs RSI
MACD and RSI (Relative Strength Index) are two technical analysis indicators used by traders to gauge changes in momentum of a security’s price. The main difference between the two is that the MACD identifies moments a price trend switches from bearish to bullish, or vice versa, while the RSI compares bearish and bullish price momentum to indicate when a security is overbought or oversold. The MACD and RSI are often used together to give traders a clearer picture of price action than either indicator could provide on its own.
In brief, the RSI plots price momentum relative to an asset’s price history to indicate when the asset may be overbought or oversold. It plots price momentum on a range from 0 to 100 with anything above 70 classified as overbought and anything below 30 as oversold.
It’s worth noting false signals can occur in either indicator. Sometimes a crossover may occur of the MACD and signal lines, only for them to immediately cross again or for price action to not change direction. Likewise, the RSI may indicate a security is overbought or oversold, but that does not guarantee a reversal will occur. By ensuring both indicators show signals of momentum reversals, you can be more confident in using the signals in your trading strategy.
MACD indicator FAQs
Is MACD a good indicator?
The MACD is a good indicator for traders looking to quickly gauge the general momentum of an asset and spot potential price reversals. However, the MACD is fairly weak in sideways markets where the volume of buy and sell orders balance each other out. In these conditions, the beginning of a crossover or divergence displayed in the indicator is not a strong signal.
In sideways markets, traders may want to focus on other technical indicators. Additionally, you should always identify multiple confirmations of a trend with various indicators before placing a trade based on technical analysis.
Read our list of the best technical indicators for alternatives to the MACD (although it’s on there too).
Additionally, the MACD uses past price action, so it is considered a lagging indicator. Therefor it cannot predict future price movements. Instead it is understood to indicate whether the current price action is likely to continue in a specific trend.
How can I tell if MACD is bullish or bearish?
You can tell if the MACD is indicating a bullish or bearish trend by looking at the position of the MACD and signal lines. The signal line represents the moving average of the MACD line. So when the MACD line crosses over the signal line or pulls away from it, a trend may be occurring.
- When the MACD line is above the signal line, it is considered bullish and represents a strong uptrend
- When the MACD line is below the signal line, it is considered bearish and represents a downtrend
The histogram displayed underneath the MACD and signal lines is another way to check for bullish and bearish trends. When the histogram moves above the zero line the price has entered a bullish trend, and when the histogram moves below zero the price has entered a bearish trend.
What does MACD 12 26 9 mean?
The numbers 12, 26 and 9 are the universal standard setting when charting the MACD indicator. Most trading platforms that integrate technical indicators like the MACD, such as City Index, use these numbers as base calculations for the indicator.
The MACD line is the difference between a 12-period SMA and a 26-period EMA, and the signal line is a 9-period SMA of the MACD line.
You have the ability to change the three numbers depending on your trading strategy. However, the numbers represent the bars displayed in candle charts, so the time periods they represent automatically change in accordance with adjustments you make in timeframes for the price action chart.
You may adjust the MACD to a shorter and longer timeframe if looking to detect even more sensitivity in price action. Another recommended figuration for shorter timeframe trading is 5,35,5.
Latest market news
Yesterday 01:32 PM
Yesterday 09:35 AM
Yesterday 07:23 AM
Yesterday 04:48 AM
Yesterday 12:17 AM
July 25, 2024 10:39 PM
Latest MACD articles

June 28, 2023 01:58 PM

July 27, 2022 09:24 AM

May 4, 2022 06:45 PM

November 2, 2021 03:10 PM