


GBP/USD Key Points
- The US economy is outperforming the struggling UK economy by a wide margin, leading to a divergence in interest rate expectations later this year.
- Traders now expect the Bank of England to start cutting rates sooner (August) and by more (50bps) than in the US (potentially as late as November, only 40bps discounted).
- GBP/USD remains in “sell rallies” mode, so bullish readers will want to be nimble against a broader backdrop that favors more downside from here.
Sometimes, it pays NOT to overthink markets.
The US economy is outperforming the rest of the developed world by a wide margin, whereas the rest of the developed world, including the UK, is struggling with lackluster economic growth:
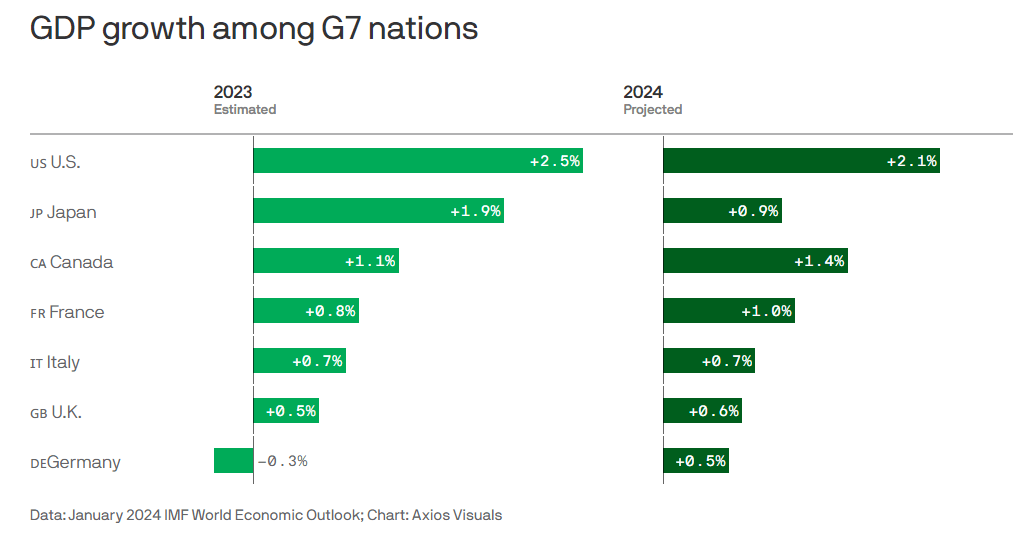
Source: IMF World Economic Outlook, Axios
Indeed, the UK has already experienced a post-COVD recession, and its recovery has been tepid at best, with slow growth and falling price pressures, compared to a US economy showing continued robust growth and stickier inflation.
Not surprisingly, money markets have noticed this divergence, and traders in those markets are now pricing in more easing from the UK (~50bps) than the US (~40bps). The market is also expecting the Bank of England to start cutting rates sooner (August) than in the US (potentially as late as November). Against that backdrop, perhaps the only surprise is that it’s taken as long as it has for GBP/USD to start falling in earnest.

British Pound Technical Analysis – GBP/USD Daily Chart
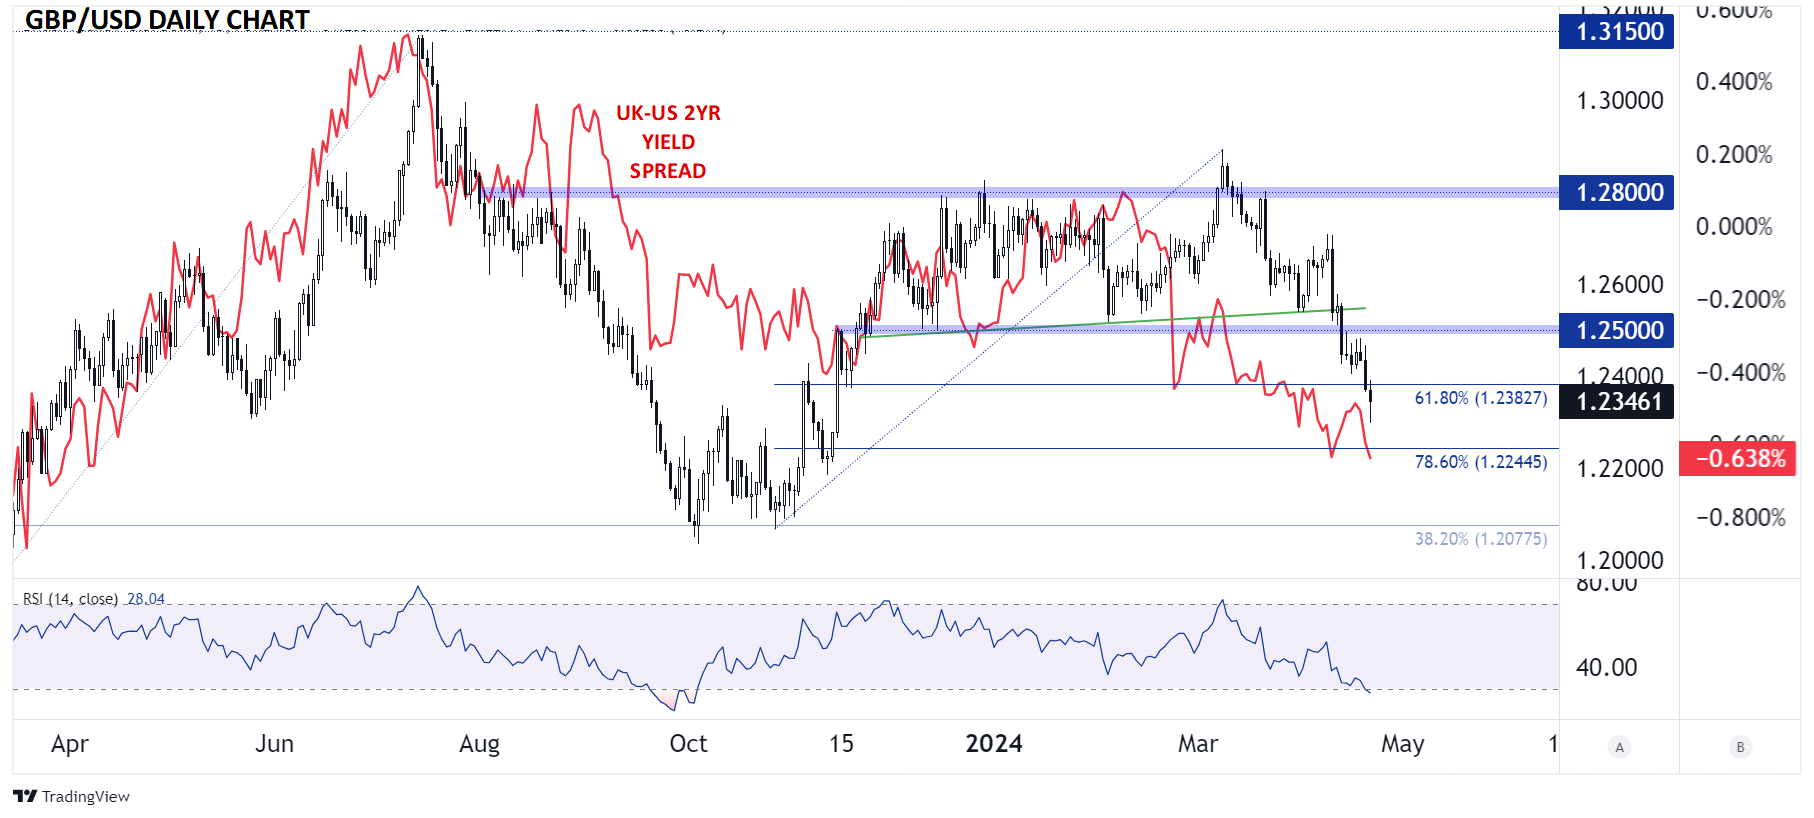
Source: TradingView, StoneX
Looking at the chart above, GBP/USD has been following the 2-year yield spread between UK bonds and US treasury bills lower for the last couple of months. The selling pressure picked up in earnest after the hotter-than-expected US CPI report on April 10, and the pair has since gone on to break below previous support at 1.2500 and, on Friday, the 61.8% Fibonacci retracement of its 5-month rally near 1.2400.
Moving forward, there is little in the way of technical support nearby until closer to the 78.6% Fibonacci retracement at 1.2245. However, GBP/USD is nearing “oversold” territory on its 14-day RSI for the first time since last September – the last previous reading before that was also in September, in 2022 – suggesting that it won’t take much to create a near-term bounce in cable.
Regardless, the pair remains clearly in “sell rallies” mode unless and until US yields stop surging, so bullish readers will want to be nimble against a broader backdrop that favors more downside from here.
-- Written by Matt Weller, Global Head of Research
Follow Matt on Twitter: @MWellerFX
Latest market news
Yesterday 01:32 PM
Yesterday 09:35 AM
Yesterday 07:23 AM
Yesterday 04:48 AM
Yesterday 12:17 AM
July 25, 2024 10:39 PM
Latest GBP USD articles

July 25, 2024 11:02 AM
July 19, 2024 11:30 AM

July 18, 2024 07:53 AM