
AUD/USD snaps 4-day winning streak, ASX 200 set to follow? Asian Open
Article
Wednesday 8:36 AM


Technical analysis refers to the use of charts generated by a trading platform or other software to analyse the direction of markets and also possible entry and exit points for trades.
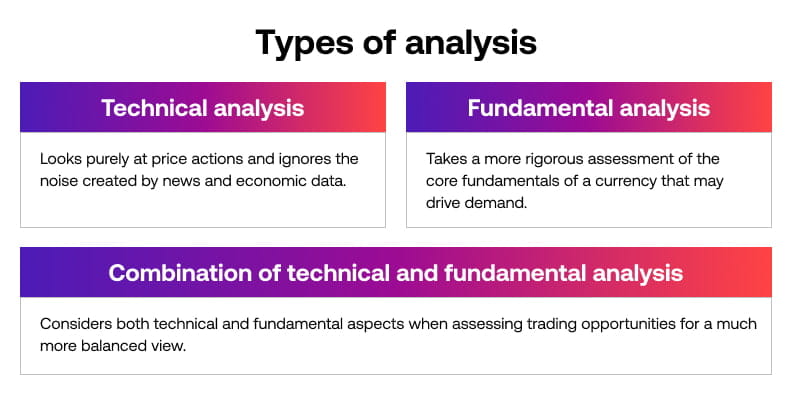
Technical analysis is different from fundamental analysis: it involves looking purely at market prices and patterns. Fundamental analysis involves any research into what is driving the price of the market. The two can be combined or used independently of each other. At each extreme, there are traders who solely use technical analysis and others who are purely fundamental traders.
Finding short term trading opportunities within the financial markets is about interpreting the current position of the market and then preparing yourself ahead of time for a potential move in your favour. It is essentially about taking a risk and seeking a positive outcome over a period of time. While it does not hold all the answers, technical analysis can be a useful tool to assist in this area.
Compared to other schools of thought, technical analysis can be considered as a neutral tool which does not rely on an analyst’s forecast based on his or her views of forecasts or whether a market is undervalued or overvalued. Instead, technical analysts choose to focus on price patterns and timing.
The advantages of technical analysis are that it can be applied to virtually any trading instrument and in any timeframe. Technical analysis can be used to analyse anything from stocks, commodities, interest rates or forex. You can also apply technical analysis from a short term perspective to a longer term time frame. In fact it can be applied to a chart ranging from minutes on an intra-day time frame to weekly or even monthly time frames.
It is important to understand that technical analysis can be used as a standalone method or it can be incorporated with other methods such as fundamental analysis or market timing methods.
Professional traders use technical analysis to create a set of clear rules and guidelines to assist in the decision making process of when, where and how to enter and exit a trade. For example, it can form part of your trading plan, establishing your rules for entering and exiting trades.
Using popular technical Indicators and chart patterns, a trader can apply readily available tools and techniques to find potential trading opportunities in the global financial markets to assist in successful trading.
Many traders and investors use technical analysis to inform them of the direction of markets. Markets are not completely random and if you see a pattern emerging, the chances are many others can too. This makes it almost a self-fulfilling trend. Traders and investors help to create the patterns we see in market prices.
You can see some of the most popular charts and measurements used by technical analysts on our site. Not only will this help you to interpret what analysts are talking about, but also to recognise patterns that could impact your own trading decisions.