S&P500 Forecast: SPX rebounds as big tech recovers & inflation is in focus
Article
Today 11:32 PM


RSI compares the average number of days that an instrument closes up to the average number of days that it closes down. This average is then rated on a scale of 1 to 100.
Traders can calculate it manually using the following formula.
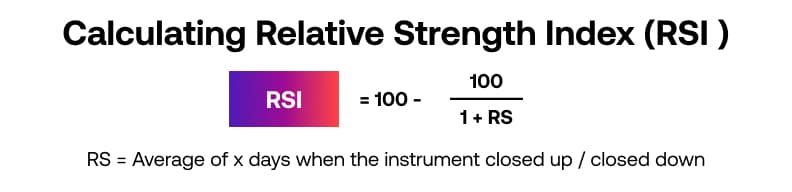
Typically, RSI is used with a 9, 14, or 25 calendar day (7, 10, or 20 trading day) period against the closing price of an instrument. If you add more days to the calculation, the value is considered less volatile.
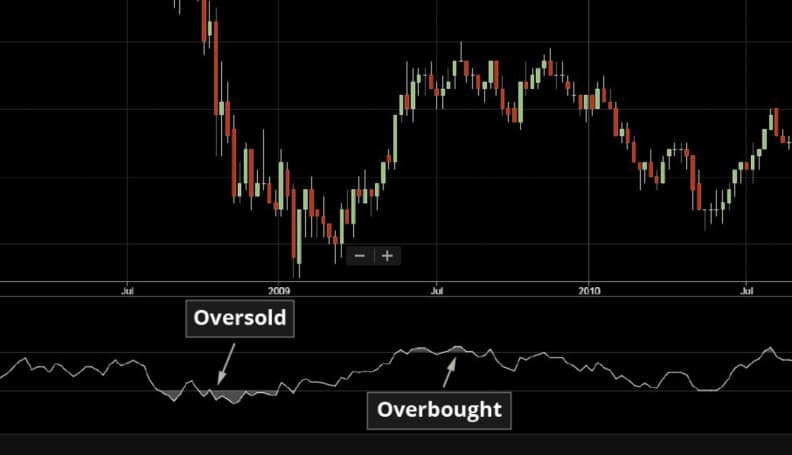
The RSI can be used to find overbought or oversold situations or it can be used to find divergences. An RSI reading below 20 suggests an oversold condition and a reading above 80 suggests an overbought condition.
When markets have reached an oversold condition it may indicate that the move has reached an exhaustion point and a reversal could be at hand. If the RSI reading is below 20 and rising then traders may use this is a potential signal to see the market reverse and start trading higher.
On the other hand, when we see situations where the market has rallied and the RSI has reached above 80 and then starts to fall, we may see a situation where the market could reverse and head lower.
It is important to understand that these signals are not 100% accurate and do not always work or provide valid signals.
Oscillators can be used on multiple timeframes ranging from minutes to hours, days and even weeks. The common time frames are daily for short term traders and weekly for longer term traders.
This indicator is useful for traders who are looking to time the market for short term reversals and profit from overbought or oversold conditions.