
EUR/USD, FTSE Forecast: Two trades to watch
Article
Thursday 6:28 PM


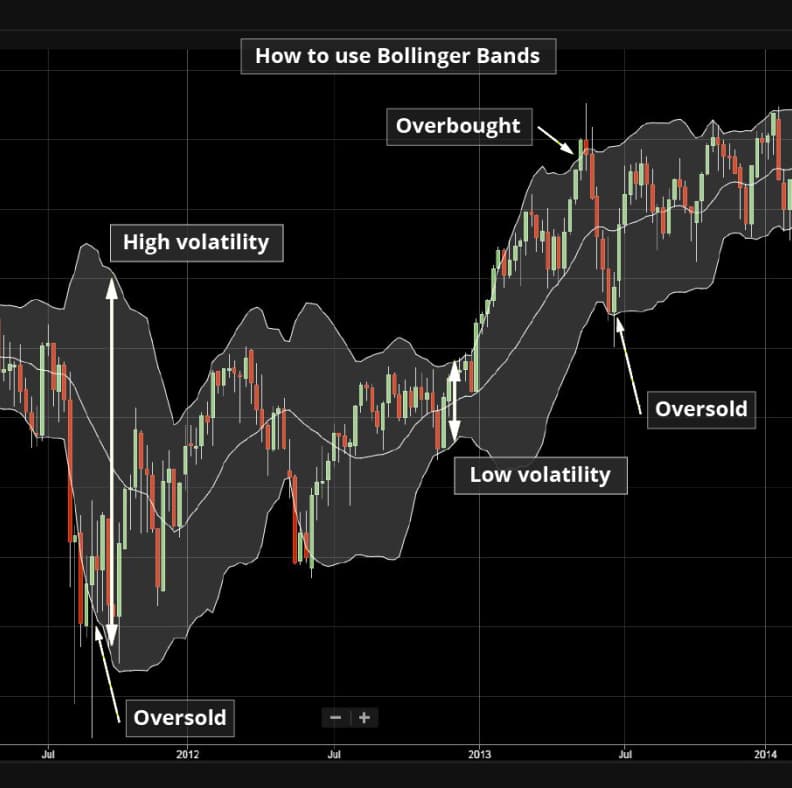
Bollinger bands forecast the potential high and low prices for a market relative to the moving average. They help traders visualise volatility and determine when a trend may continue or reverse.
An upper band is created above the moving average and a lower band below the moving average. The bands widen during volatile periods and contract during non-volatile periods.
You can overlay Bollinger bands directly onto charts in our advanced Advantage Web platform as well as on our mobile apps.
Bollinger bands consist of three bands:
During normal market conditions, the bands usually appear to move in a synchronous pattern, but you can use them to view market volatility.
When price movements closely follow the middle band, traders consider the instrument to be trading within its average.
These bands are continually changing based on the real-time price movements of the instrument and traders read the bands in a number of different ways.
When price moves are close to the upper band, the current price of the instrument is considered high relative to recent prices. If they cross the upper band, traders consider the instrument to be overbought.
When price moves are close to the lower band, the current price is considered low relative to recent prices. If they cross the lower band, traders consider the instrument to be oversold.
When price movements closely follow the middle band, traders consider the instrument to be trading within its average.
Bollinger bands can be used on multiple timeframes, ranging from minutes, hours, days and weeks. The common time frames are daily for short term traders and weekly for longer term traders.
This indicator could be useful for traders who are seeking to find trend reversals when either the upper or lower channels of the Bollinger bands have been reached. The reversals can last from short to longer periods of time, and can therefore be used for all types of traders who may consider intraday trading to position trading.