


- Crude oil already supported on raised geopolitical risks
- IMF raises global GDP forecasts thanks to resilient US economy
- WTI technical analysis suggests path of least resistance to the upside

At the start of this week, oil prices fell back noticeably on Monday and there was some further downside at least initially earlier today. However, prices have since turned higher, which would appease bullish traders. More on that later, but while there were no obvious triggers behind the move, we have had more headlines from the region with US President Joe Biden saying he has decided how the US will respond to a drone strike that killed three American troops in Jordan at the weekend.
Oil finds support from improved demand outlook
In addition to the escalation of the Middle East situation, crude oil investors have welcomed signs the global economy might perform better than expected. Those expectations were boosted after the IMF lifted its forecasts on world growth outlook, thanks to a resilient US economy and China’s fiscal support programmes. The IMF reckons the global economy will be expanding 3.1% this year, up from 2.9% seen in October, and 3.2% in 2025. Earlier today, we learnt that the Eurozone economy avoided a technical recession. So, the demand outlook for oil has improved, and this is helping to keep prices, already supported by supply worries, elevated.
WTI closed up nearly 6 and a half percent following the escalation of the situation in the Middle East and shipping woes last week. It could further expand those gains in light of today’s bullish reversal.
Looking ahead, we will have the latest inventories report from the US with the American Petroleum Institute (API) set to release its numbers after the close ahead of the official Energy Information Administration (EIA) on Wednesday. The big 9.2 million drawdown that was reported by the EIA last week was at least partially responsible behind the big gains we saw in WTI last week, and the narrowing of the spread between Brent and WTI contracts.
Video: WTI technical analysis and insights on gold, copper and FX majors
WTI technical analysis: key levels and factors to watch
Let’s start off by looking at the weekly chart of WTI crude oil.
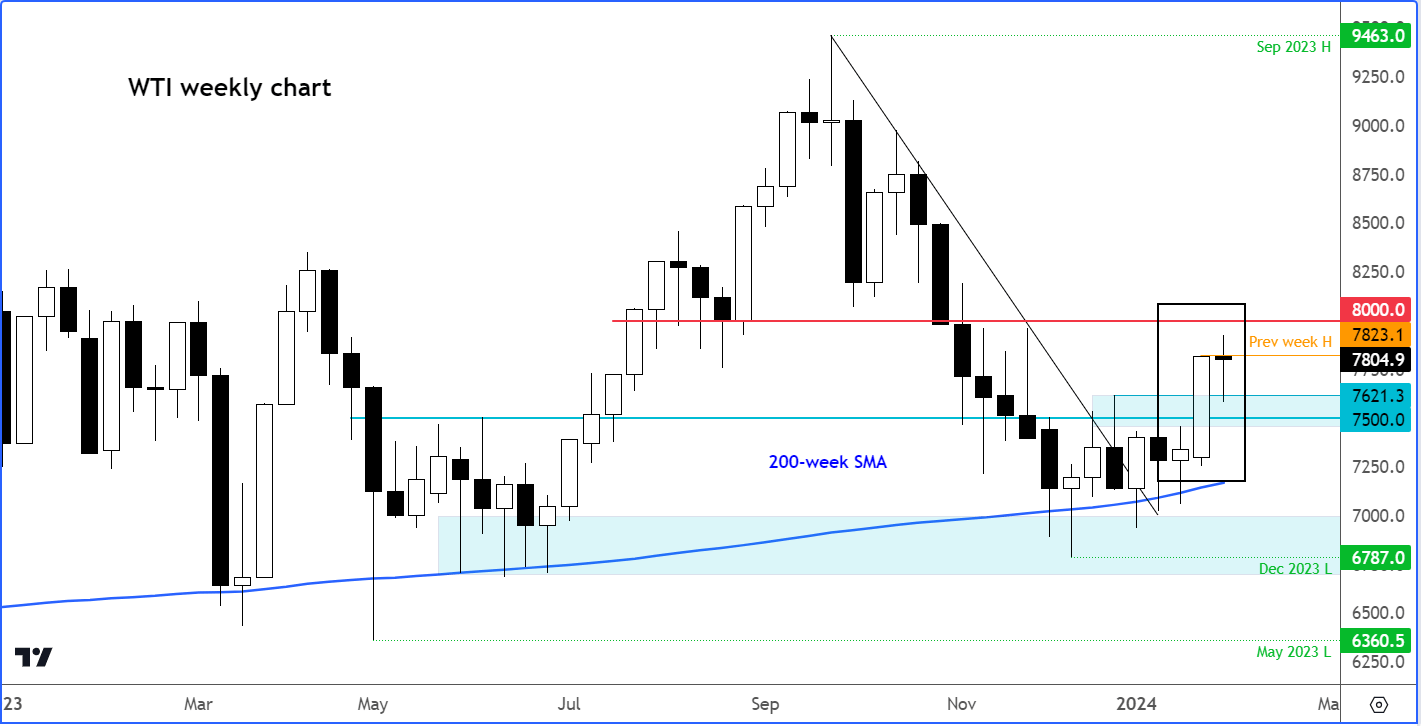
Last week's breakout means that the path of least resistance is now to the upside, despite the weaker start to this week. The large thrust candle from last week that lifted prices well clear of $75.00 handle, is a strong indication that more gains could be on the way, possibly towards $80 next,
Looking at crude oil prices in great detail, below we have the daily chart.
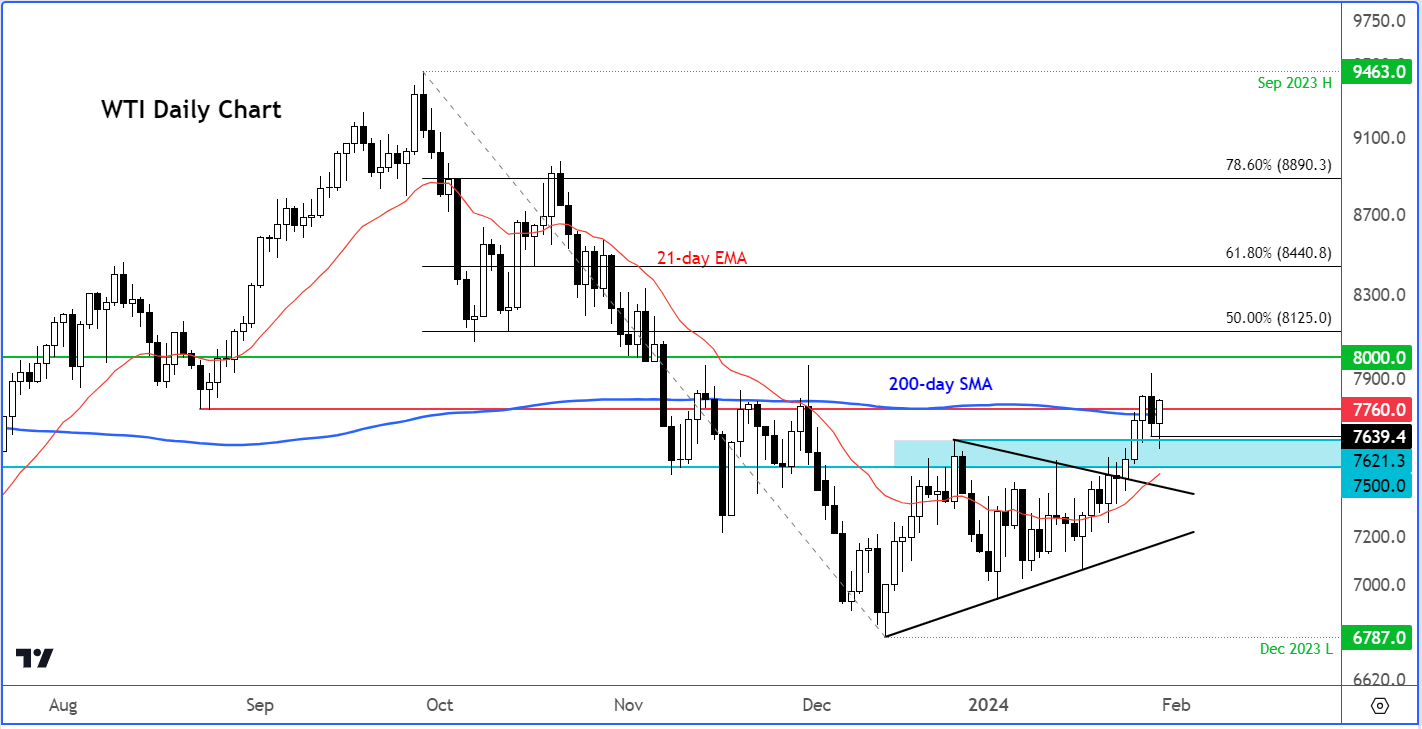
As you can see, prices broke out of their consolidation phase to the upside and have moved above the 21-day exponential and, momentarily at least, the 200-day moving average as well before pulling back down a little bit.
The key level of resistance that I had highlighted previously was at around $77.60. The price of oil has struggled to rise above that level ever since breaking below it back in November of last year, and once again this week, we've seen some struggles around this area. We also have the 200-day moving average, of course, providing additional resistance. So, this is the key level to watch. If we get above this level on a daily closing basis, I think this would be a further bullish development from a technical point of view.
Let's see if that will happen today, and if so, the next upside target could be the $80 level, which is a psychologically important level.
The shaded blue area highlighted on my chart, around $75.00 to $76.20 is now the key support zone in my view for oil. This area had previously provided resistance before the breakout. Now it's being tested from above, and so far, it's holding firm. Bullish crude oil traders will be happy to see that prices have refused to hold below the low of the previous day's candle, when it created a bearish-looking price candle. The fact that it has bounced back despite breaking through this level earlier is a sign of strength. If it can hold in the green now, this would be a strong bullish signal for the days to come – especially as have already had a strong signal created on the weekly time frame last week.
The path of least resistance on crude oil will remain to the upside unless we see a distinct bearish reversal pattern at higher levels now, or if we go back below $75.00 support, which is now the line in the sand for me.
Source for all charts used in this article: TradingView.com
-- Written by Fawad Razaqzada, Market Analyst
Follow Fawad on Twitter @Trader_F_R
How to trade with City Index
You can trade with City Index by following these four easy steps:
-
Open an account, or log in if you’re already a customer
• Open an account in the UK
• Open an account in Australia
• Open an account in Singapore
- Search for the company you want to trade in our award-winning platform
- Choose your position and size, and your stop and limit levels
- Place the trade
Latest market news
Yesterday 06:37 AM
April 26, 2024 01:25 PM
April 26, 2024 11:40 AM
Latest Crude Oil articles

April 22, 2024 04:00 PM

April 19, 2024 03:35 AM

April 17, 2024 05:00 PM