


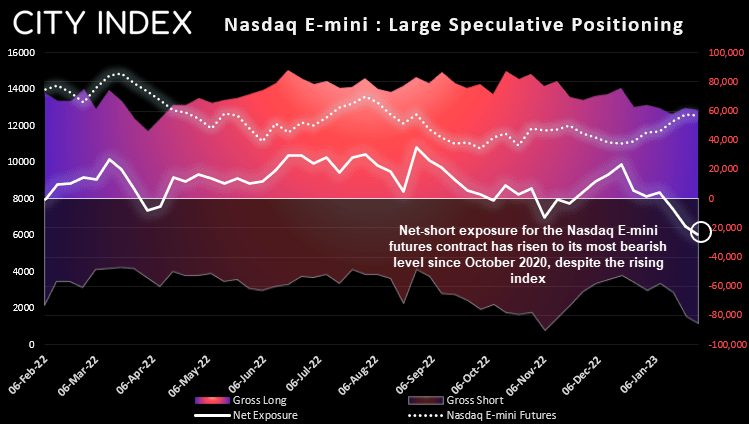
Traders increase bearish exposure to the Nasdaq whilst prices rise
It’s been a great start to the year for the Nasdaq 100, which has risen over 14% so far and has outperformed the Dow Jones and S&P 500. Yet after such strong moves, there comes a point where mean reversion must surely kick in. And looking at the market positioning of large speculators, they’re either erring on the side of caution or betting that the index will fall over.
The most recent COT report (commitment of traders) shows that net-short exposure for the Nasdaq 100 E-mini futures contract is at its most bearish level since October 2020. This means the market has to fall to justify the net-short exposure, otherwise a break higher could trigger some short-covering and add fuel to a bullish fire.
Seasonality has favoured bears in February, over the past thirty years
We like to see seasonality on a market as it can sometimes provide a tendency for prices to move one way or another. So it is interesting to note that the Nasdaq has averaged negative returns in February over the past 30-years.
- The Nasdaq 100 has posted a negative average return of -0.28% in February over the past 30 years
- It has also closed lower 55.2% of the time.
- The average winning month has been 6.05%
- The average negative month has been -5.4%
However, more recent years this seasonal tendency has been less reliable, with a positive average return over the past 10 and 15 years yet a negative avg, return over the past five. So whilst this muddies the water for seasonally-generated bias for February we have noted something of interest for potential volatility.
February has been the most volatile month (on average) over the past five years
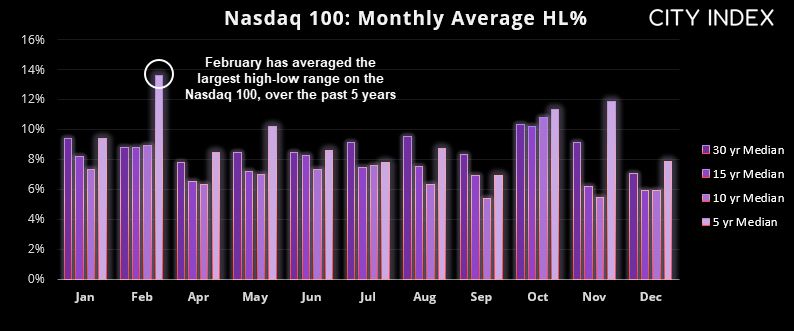
Over the past five years, the high-to-low range (HLR) of the Nasdaq’s monthly candle has been 13.6% - and the most volatile month of the year. Yet the prior 10, 15 and 30-years averaged a high-to-low month around 8.8%. Does this mean we’re in for another volatile month?
So far this month, the Nasdaq has produced a HLR of 3.25%, which is just under a quarter for February’s 5-year average. We’ve had six trading days in Feb so far and 14 to go, which leaves over half of the month left to post a strong move in either direction. Of course, a key driver for market sentiment at the moment is being derived from key US economic data and Fed members speaking, as traders try to decipher if we really will see interest rates ‘higher for longer’ (bearish for stocks), or whether the Fed will cut sooner than later (bullish for stocks).
US inflation is a key data point next week for global markets
The main event next week is the US inflation report at 00:30 AEDT on Wednesday morning (Tuesday in the US) and it can easily turn the dial for Fed expectation. A soft print likely lowers the Fed fun futures curve, weighs on the US dollar and send stocks higher. However, the more volatility reaction may come from a hotter-than-expected inflation report, as it is the last thing markets want to hears. And that could topple indices further from their YTD highs, drag gold with it and propel the US dollar higher.
Nasdaq 100 daily chart:
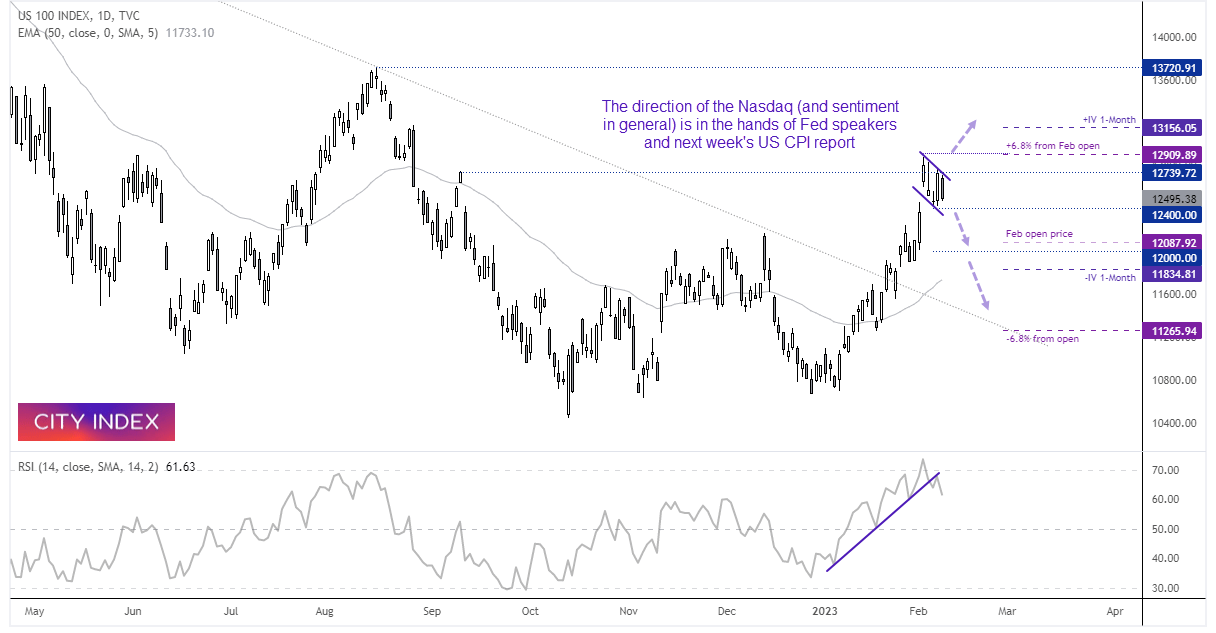
The Nasdaq briefly traded above the September high before pulling back. Momentum has been strong into the current highs with little in the way of a pullback (which a hot CPI report would likely trigger, although RSI (14) recently entered the overbought zone and has since pulled back with prices.
Bearish scenario:
A daily close or break below 12400 suggests a correction is underway, with 12,000 being a viable target due to its round-number status, and it is also near the monthly open price. But if momentum does turn lower and the Fed become increasingly hawkish, note that -6.8% from Feb’s open (half of February’s HLR) is all the way down at 11,265, although the 1-month implied volatility is currently around 11,834.
Bullish scenario:
If any downside break lacks bearish legs, bulls could seek low volatility dips above 12000 – 12,100 and anticipated a break to news highs. Alternatively bulls could wait for a break above the cycle high to assume bullish continuation. And of we project the full HLR average of 13.6% from February’s open, the upper bound sits above 16,000.
Latest market news
Yesterday 01:32 PM
Yesterday 09:35 AM
Yesterday 07:23 AM
Yesterday 04:48 AM
Yesterday 12:17 AM
July 25, 2024 10:39 PM
Latest Trade Ideas articles

Yesterday 09:35 AM

Yesterday 12:17 AM

July 25, 2024 10:39 PM

July 25, 2024 05:30 PM