


February 16, 2023 7:44 AM
The US 10-Year Yield had been rising since August 2nd in an ascending wedge formation until it broke above the top trendline, making a high on October 21st at 4.335%. As often is the case, when price (or in this case yields) fail to hold a breakout on one side of the pattern, it often moves to test the opposite side. The key US yield finally broke below the bottom of trendline of the pattern on November 10th, 2022, and moved aggressively lower (recall that on November 10th, 2022, the US released a very weak CPI print. Since then, US 10-Year Yields have traded in a range between 3.321% and 3.90%. The 50% retracement from the low of August 2nd, 2022, to the high of October 21st, 2022 is 3.426%, however, it has acted as support multiple times for the benchmark yield.
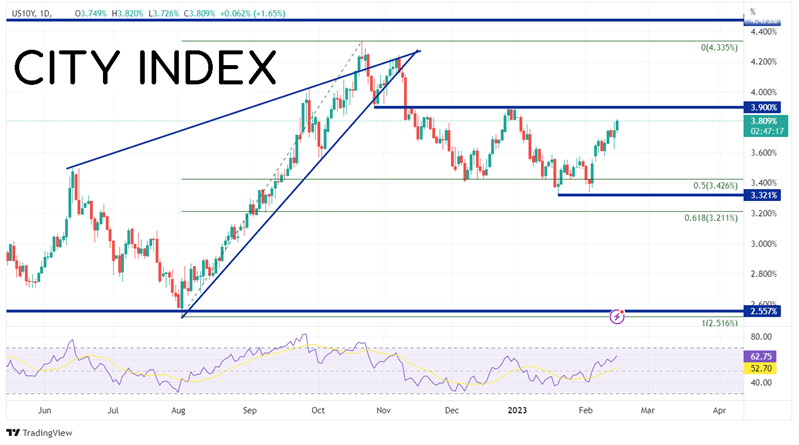
Source: Tradingview, Stone X
Trade US 10 yields now: Login or Open a new account!
• Open an account in the UK
• Open an account in Australia
• Open an account in Singapore
On a 240-minute timeframe, yields are currently within the previously mentioned range near 3.80%. If yields break prior highs at 3.90%, they will have formed a double bottom pattern. The target for a double bottom is the height from the bottom to the breakout point, added to the breakout point. In this case the target is above the October 21st, 2022 high, near horizontal resistance from 2007 at 4.473%.
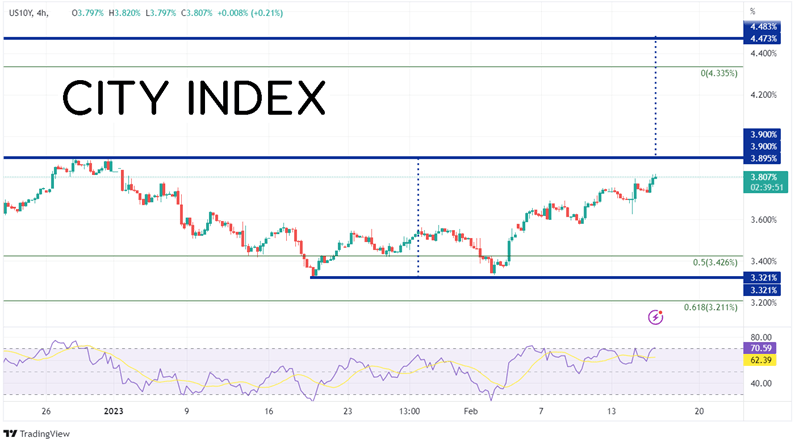
Source: Tradingview, Stone X
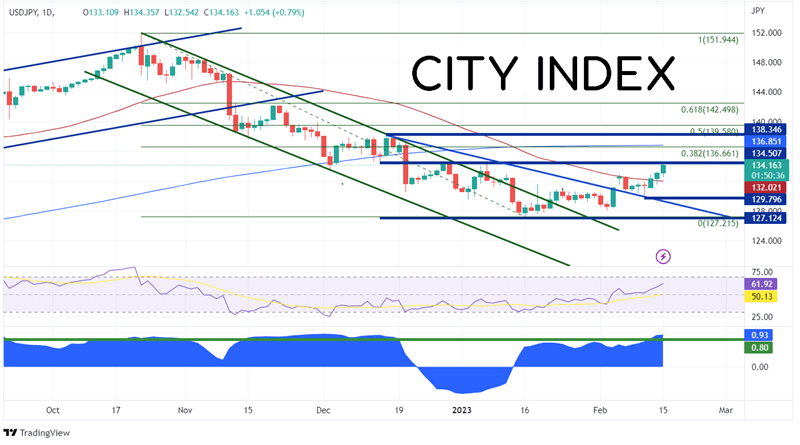
Below is a daily chart of USD/JPY. In the bottom panel of the chart is the correlation coefficient between USD/JPY and US 10-year yields. The current correlation coefficient is +0.93. Readings above +.80 are considered statistically significant. A reading of +0.93 means that when US yields move in one direction, there is a strong correlation and USD/JPY should move in the same direction. A reading of +1.00 is a perfect correlation and indicates that the two assets move together 100% of the time. Notice that the correlation has only recently moved back into relevant territory on February 13th. Prior to this, the two assets haven’t been correlated in 2 months!
Source: Tradingview, Stone X
USD/JPY has also been trading in a range since mid-December 2022 between 127.22 and 134.50. The pair recently has broken above channel resistance, a downward sloping trendline dating to December 15th, 2022, and the 50-Day Moving Average. If USD/JPY moves above recent highs at 134.77 (most likely with a move higher in 10-year yields), there is a confluence of resistance at the 38.2% Fibonacci retracement from the October 21st, 2022, highs to the January 16th lows and the 200-Day Moving Average between 136.66 and 136.85. Above there is horizontal resistance at 138.35 and then the 50% retracement level from the above-mentioned timeframe at 139.58. However, if US yields move lower, it may pull USD/JPY lower with it. First support is the 50-Day Moving Average at 132.02. Below there, the pair can fall to the February 10th lows at 129.80, then the downward sloping trendline near 129.30.
Trade USD/JPY now: Login or Open a new account!
• Open an account in the UK
• Open an account in Australia
• Open an account in Singapore
US 10-Year Yields and USD/JPY currently have a strong correlation coefficient of +0.93. Readings above +0.80 are considered strong. Therefore, to get a better idea of where USD/JPY may be headed, keep an eye on US yields. If they move higher, USD/JPY is likely to move with them. However, if yields pullback, watch for USD/JPY pull back as well.
Learn more about forex trading opportunities.
Latest market news
Yesterday 01:32 PM
Yesterday 09:35 AM
Yesterday 07:23 AM
Yesterday 04:48 AM
Yesterday 12:17 AM
July 25, 2024 10:39 PM
Latest Trade Ideas articles

Yesterday 09:35 AM

Yesterday 12:17 AM

July 25, 2024 10:39 PM

July 25, 2024 05:30 PM