


Back in October, we made an outlandish call for Tesla to more than halve and fall from $220 down to $100. Four months later, we are both delighted and somewhat saddened to see it came to fruition almost perfectly (although technically it only fell to $101.81, leaving out bear call out of pocket by $1.81 per share). It was nothing personal against the company or Elon, but we simply looked at the data and hypothesised an idea based it. So where is Tesla to go from here?
Incidentally, the stock is almost right back where it was in October and trades at $202.35, having more than doubled and rallied 113.8% in just six weeks.
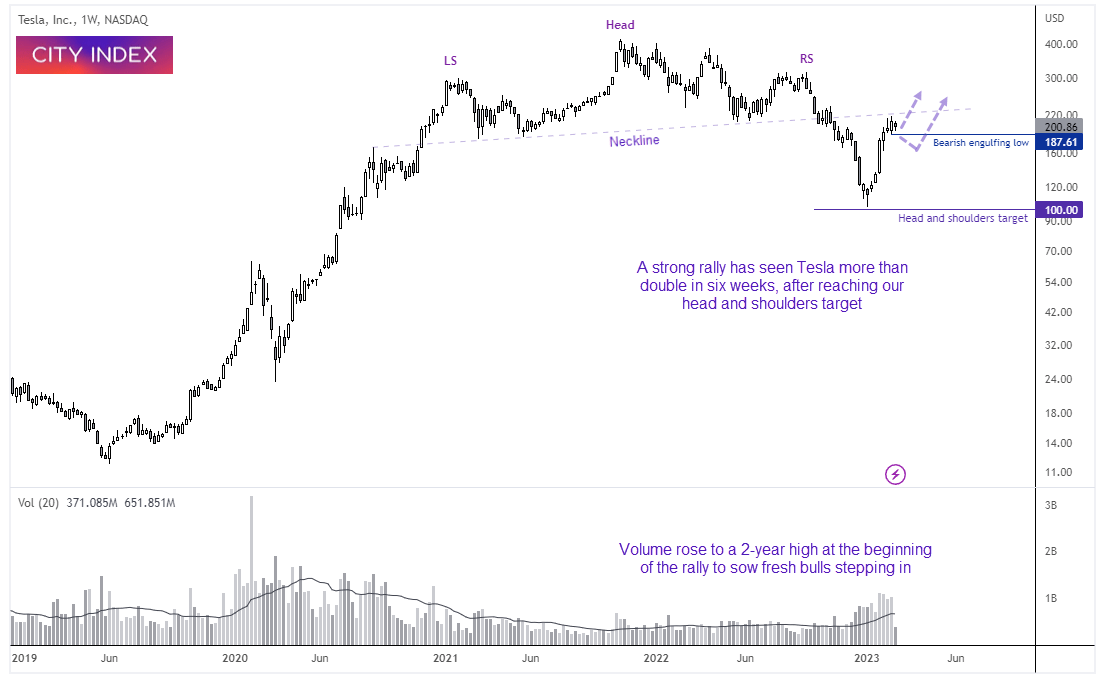
Tesla (TSLA) weekly chart:
We can see on the weekly chart that the rally from $100 has been string and in a relatively straight line, and volumes rose to a two-year high to show fresh buyers entered the market and bears closed out. However, we’re approaching the broken neckline which could potentially prompt a pullback (or a consolidation), but the strong volume and price action suggests it could eventually break above it.
And whilst a bearish hammer formed two weeks ago, it was followed by a bullish engulfing week with higher volume to show demand at these highs. Therefore, a break below 187.61 assumes a pullback, but bulls may be interested in loading above this key level for a move to the neckline around $225.
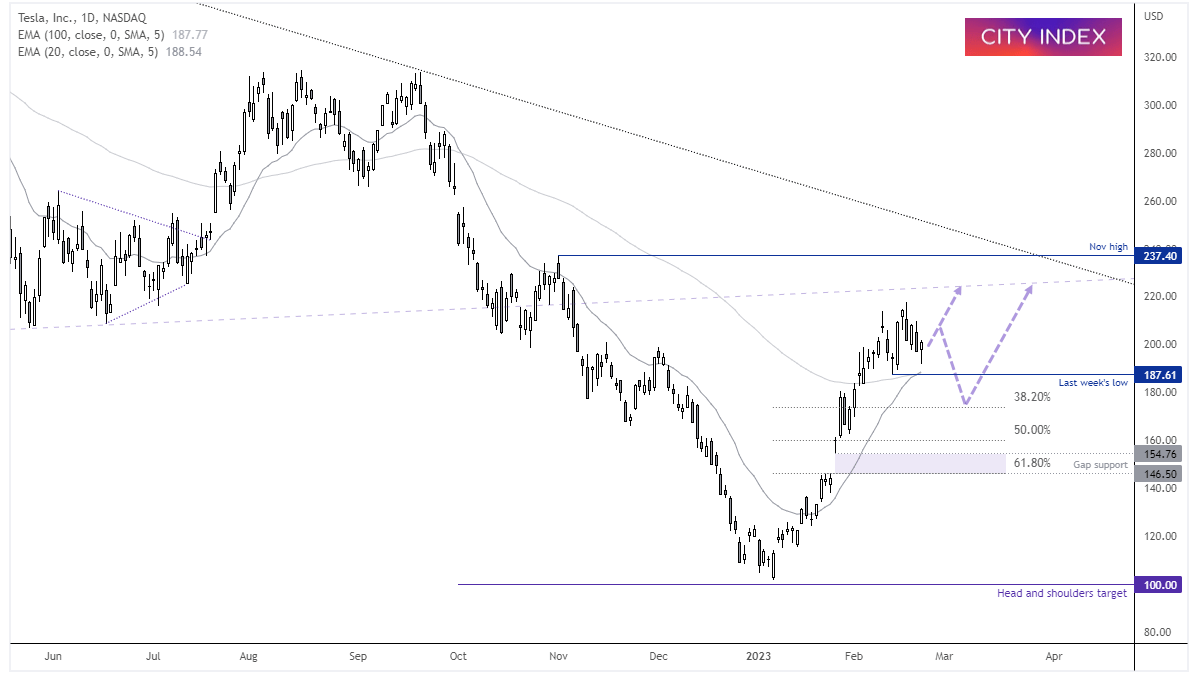
Tesla (TSLA) daily chart:
The daily chart shows a small pullback withinside the range of a bullish engulfing candle at the highs. A small bullish hammer formed yesterday for a potential higher low above last week’s low, and the daily engulfing candle. After-hours trade also see it trade slightly higher. Also note that the 20 and 100-day EMA’s sit perfectly on last week’s low, making $187.61 an important support level for bulls to defend. RSI (14) remain positive above 50, so we’re looking for another burst higher on the daily chart.
- The bias on the daily chart is bullish above $187.60
- We anticipated a move towards the $220 - $225 area (along the neckline, depending on how quickly it gets there), where we may then see a pullback from the broken neckline
- Keep in mind the November high around $237.4 which could also cap gains over the near-term
- A break below $187.60 assumes a deeper correction, where we’d then look for evidence of a swing low around a Fibonacci number or the ‘gap support’ zone’ (at which point reconsider longs, in line with weekly volume and momentum)
Latest market news
Yesterday 01:32 PM
Yesterday 09:35 AM
Yesterday 07:23 AM
Yesterday 04:48 AM
Yesterday 12:17 AM
July 25, 2024 10:39 PM
Latest Trade Ideas articles

Yesterday 09:35 AM

Yesterday 12:17 AM

July 25, 2024 10:39 PM

July 25, 2024 05:30 PM