


March 16, 2022 5:04 AM

Tencent Holdings LTD is down nearly 20% over the last 2 days as Chinese Banking officials are set to pass down a record fine worth “hundreds of millions of Yuan”. According to the Wall Street Journal, the company faces violations related to its WeChat Pay mobile network, as the firm is said to have failed to comply with regulations regarding Know Your Customer and Know Your Business. In addition, the firm is also being hit with penalties for failing to regulate transfers of illicit funds and money laundering, such as for transactions related to gambling. Until now, the large tech company had escaped the big crackdown on tech firms by Chinese authorities. It should also be noted that the stock has been dragged lower by the overall performance of the Hang Seng in general, which is down 20% in the last 11 trading days.
Tencent made an all-time high on February 18th, 2021 at 772.50 and has been moving lower since. The stock attempted a rally in May 2021 but failed, thus falling through the neckline and creating a head and shoulders pattern. The target for the pattern is the height from the head to the neckline, added to the breakdown point at the neckline. In this case the target was near 330. The target was finally reached yesterday. The stock price also fell through horizontal support (lows of March 2020) at 323. Notice the RSI is extremely oversold at 12.03, an indication that price may be ready for a bounce.
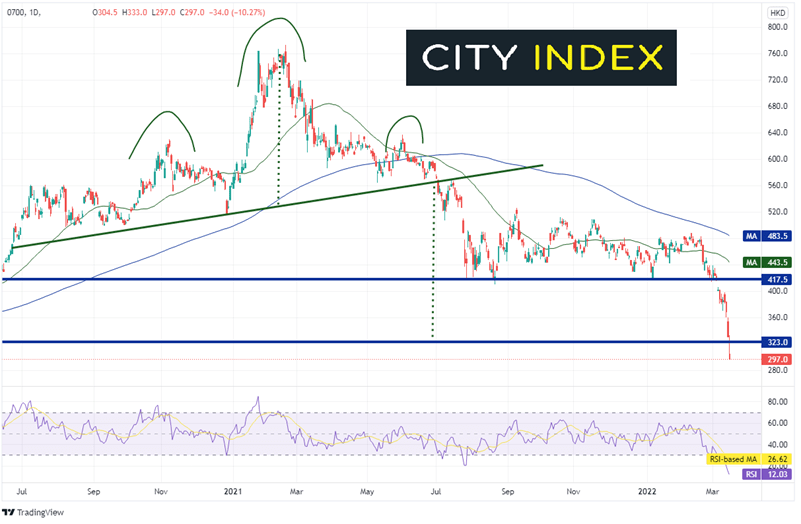
Source: Tradingveiw, Stone X
Trade Tencent now: Login or Open a new account!
• Open an account in the UK
• Open an account in Australia
• Open an account in Singapore
For support and resistance levels, its best to zoom out to a weekly chart. The first support level is the previous low from the week of October 28, 2018 near 249. Below there is the 127.2% Fibonacci extension from the low of the week of March 16th, 2020 to the highs in February 2021, near 200.50. First resistance is at previous support of 323, then the gap fill from last week at 360. Above there, horizontal resistance crosses at the lows from the week of August 16th, 2021 near 410.
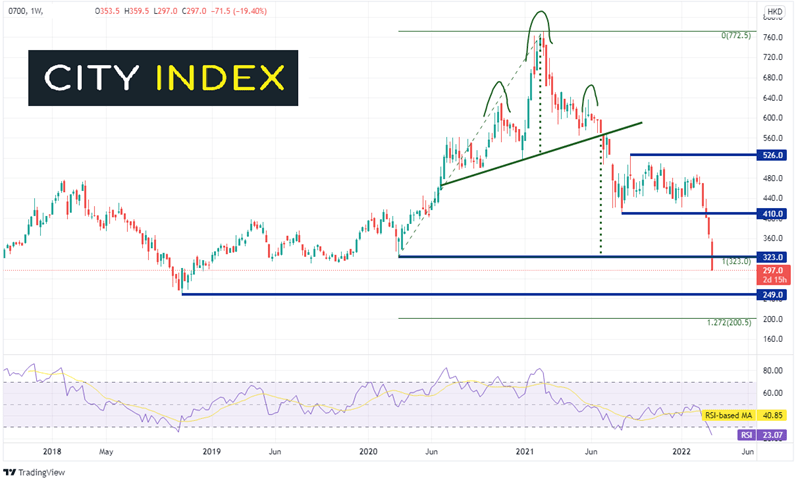
Source: Tradingveiw, Stone X
Tencent Holdings had been moving lower before this week, as it was falling with the Hang Seng. However, record fines for failure to follow regulations helped Tencent to underperform the stock index. Given that it has fallen so far, so fast, along with the extremely oversold RSI indications, it’s possible that the stock may be ready for a near term bounce!
Learn more about equity trading opportunities.
Latest market news
Yesterday 01:32 PM
Yesterday 09:35 AM
Yesterday 07:23 AM
Yesterday 04:48 AM
Yesterday 12:17 AM
July 25, 2024 10:39 PM
Latest Trade Ideas articles

Yesterday 09:35 AM

Yesterday 12:17 AM

July 25, 2024 10:39 PM

July 25, 2024 05:30 PM