


New Zealand’s inflation figures for Q1 2023
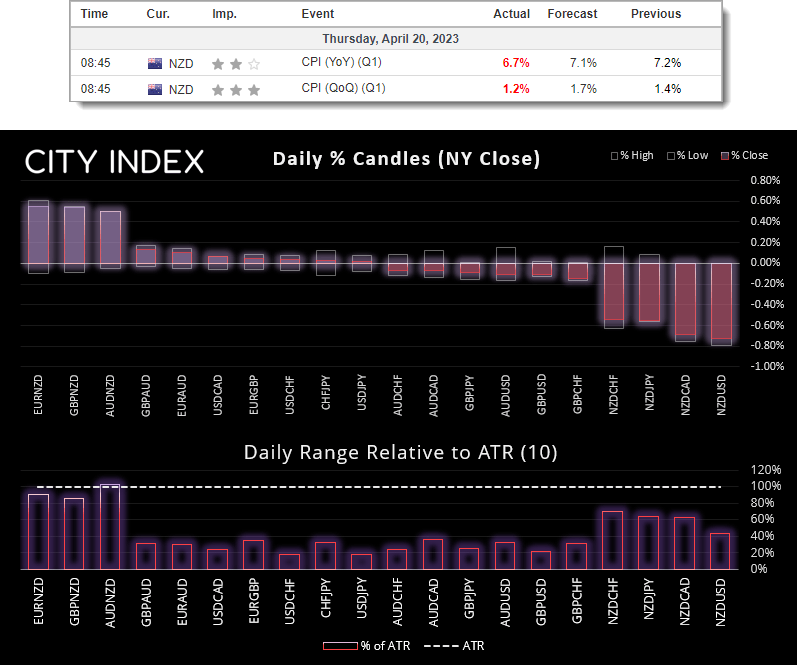
- CPI rose 6.7% y/y, below 7.1% forecast and 7.2% prior
- Quarterly inflation rose at its slowest pace in 8-quarters by 1.2% q/q
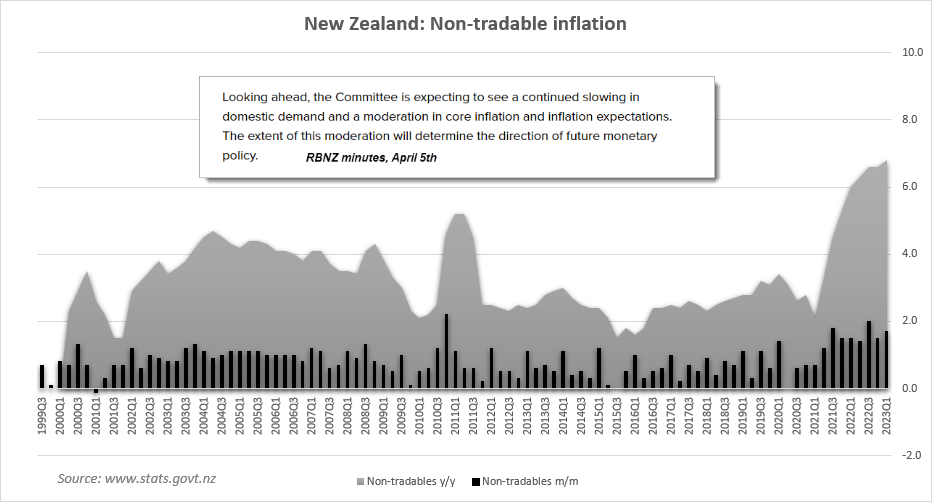
- Non-tradables (domestic services) increased by 6.8% y/y and 1.7% m/m
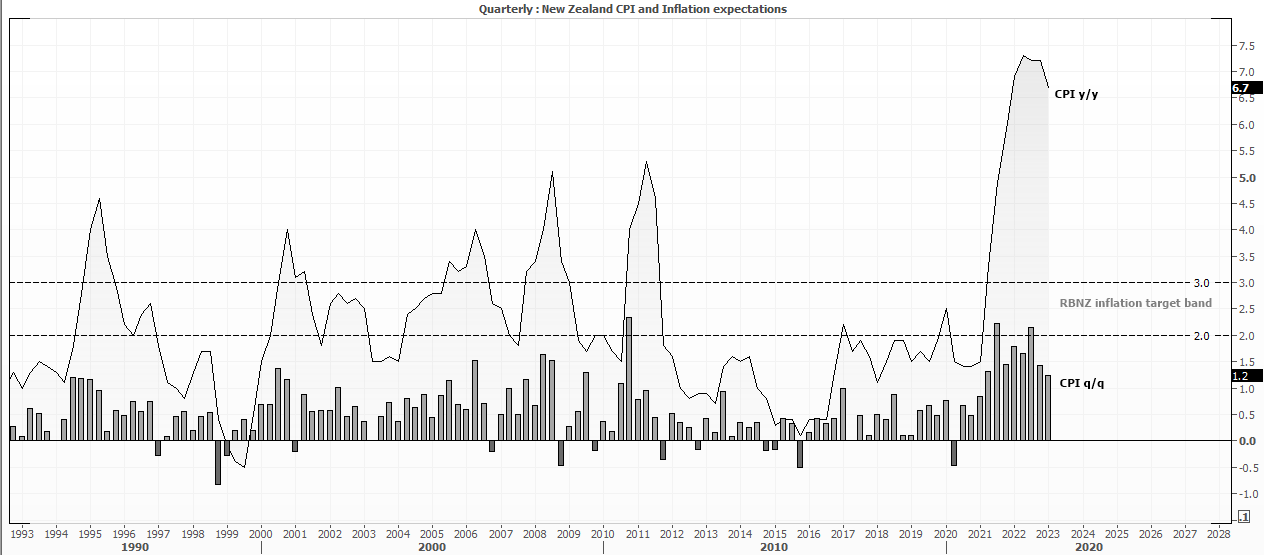
At first glance, the headline inflation figures for New Zealand are very promising indeed. Inflation seemingly peaked at 7.3% y/y in the June quarter, softened slightly to 7.2% in the December quarter and has now slowed to a rate below both market and the RBNZ’s forecast of 7.1% to 6.7% y/y. CPI also slowed to 1.2% q/q (its lowest rate in eight months). Given Q4 figures were only slightly beneath the peak and did not capture the impact of cyclones, there were some concerns that inflation could remain sticky above 7%, so traders were quick to short NZD across the board when it came in below expectations.
However, a fly in the ointment is that non-tradable inflation continues to rip higher. Non-tradable inflation looks at domestic price pressures which is mostly services or goods not impacted by foreign competition or market pricing. The RBNZ are keeping a close eye on domestic price pressures, and with non-tradable CPI ripping higher it suggests domestic demand remains hot, and likely helped by a large spike in net immigration. Therefore, despite a decent move lower on headline CPI figures, the rise of non-tradable inflation likely removes the argument for a pause, so perhaps the RBNZ will opt to hike by 25bp instead of 50bp at their May 24th meeting.
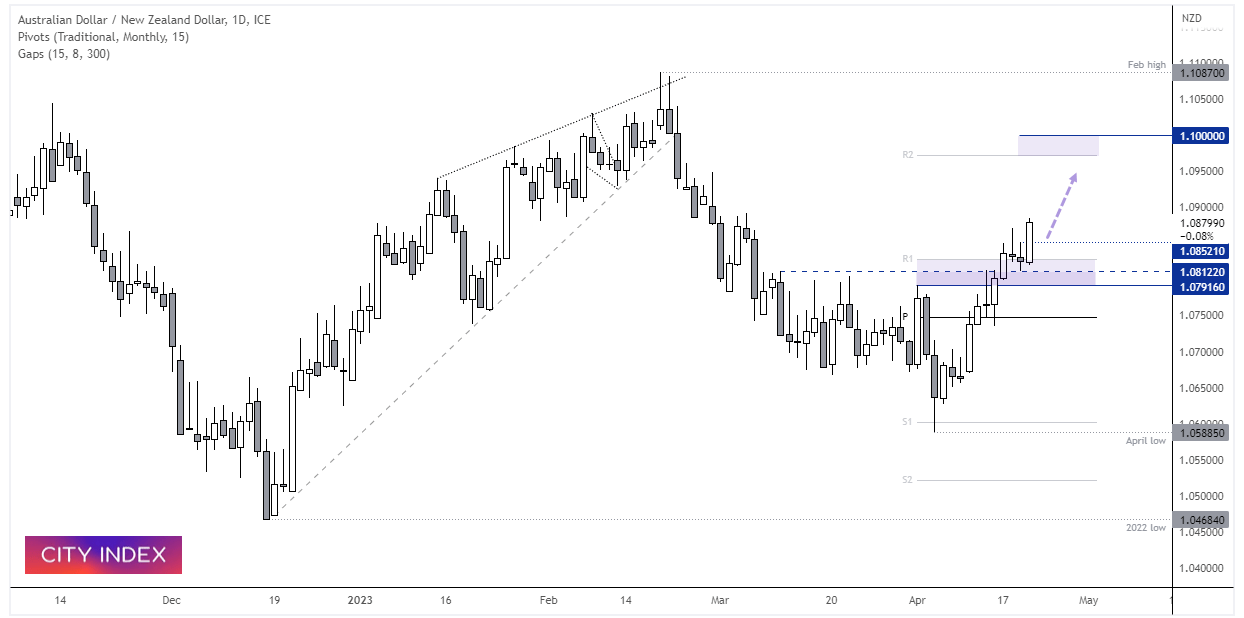
AUD/NZD daily chart:
Concerns that the RBNZ will tip New Zealand into a recession have weighed on the Kiwi dollar recently, but soft headline inflation figures have helped push the cross higher from a support zone. Whilst there’s still a case for a hike from the RBNZ, they may be near their terminal rate whilst the Aussie is supported by bets that Australia will avoid a recession. From here we see the potential for AUD/NZD to extend its trend towards the 1.1000 handle, or the monthly R2 pivot 1.0970.
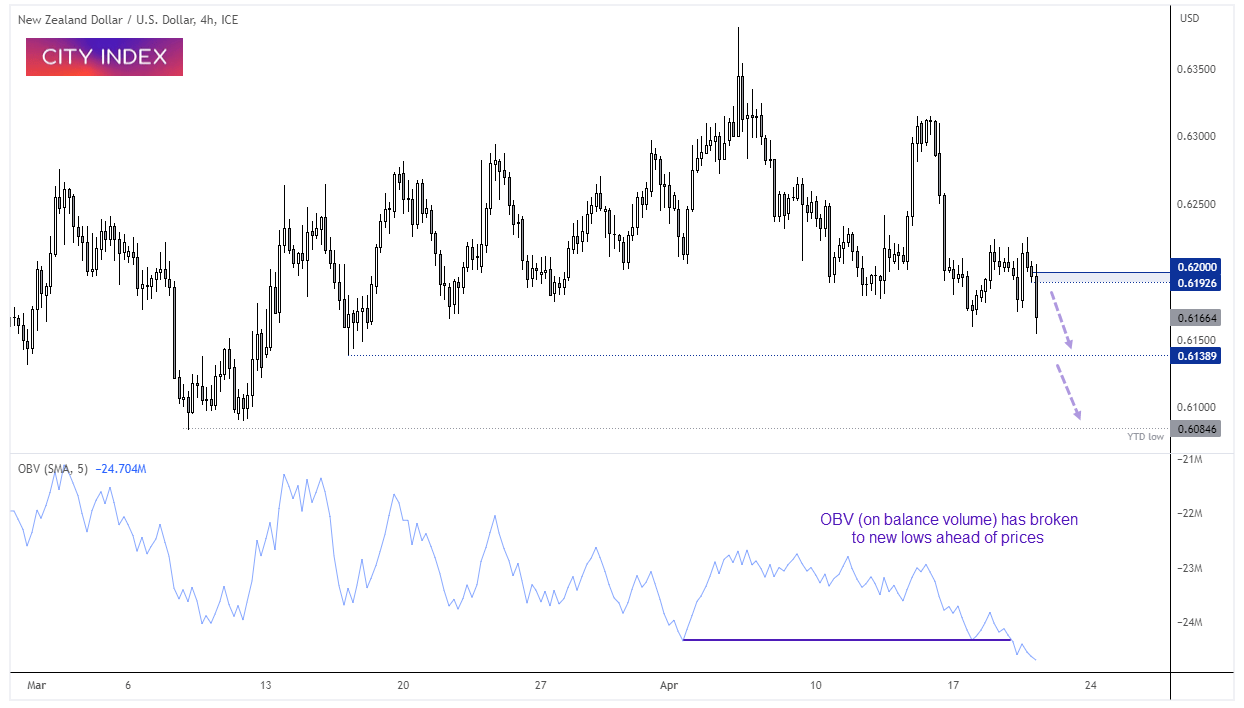
NZD/USD daily chart:
The Fed continue to make hawkish comments ahead of the blackout period which begins on Saturday (where they do not comment on monetary policy ahead of the Fed’s next meeting). This provides a bearish opportunity for NZD/USD, although to increase the reward to risk potential we would like to see prices retrace higher towards the 0.6200 handle and seek evidence of a swing high on a lower timeframe. Bears could then target the 0.6140 low, a break of which beings the YTD low into focus.
-- Written by Matt Simpson
Follow Matt on Twitter @cLeverEdge
How to trade with City Index
You can trade with City Index by following these four easy steps:
-
Open an account, or log in if you’re already a customer
• Open an account in the UK
• Open an account in Australia
• Open an account in Singapore
- Search for the market you want to trade in our award-winning platform
- Choose your position and size, and your stop and limit levels
- Place the trade
Latest market news
Yesterday 01:32 PM
Yesterday 09:35 AM
Yesterday 07:23 AM
Yesterday 04:48 AM
Yesterday 12:17 AM
July 25, 2024 10:39 PM
Latest Trade Ideas articles

Yesterday 09:35 AM

Yesterday 12:17 AM

July 25, 2024 10:39 PM

July 25, 2024 05:30 PM