


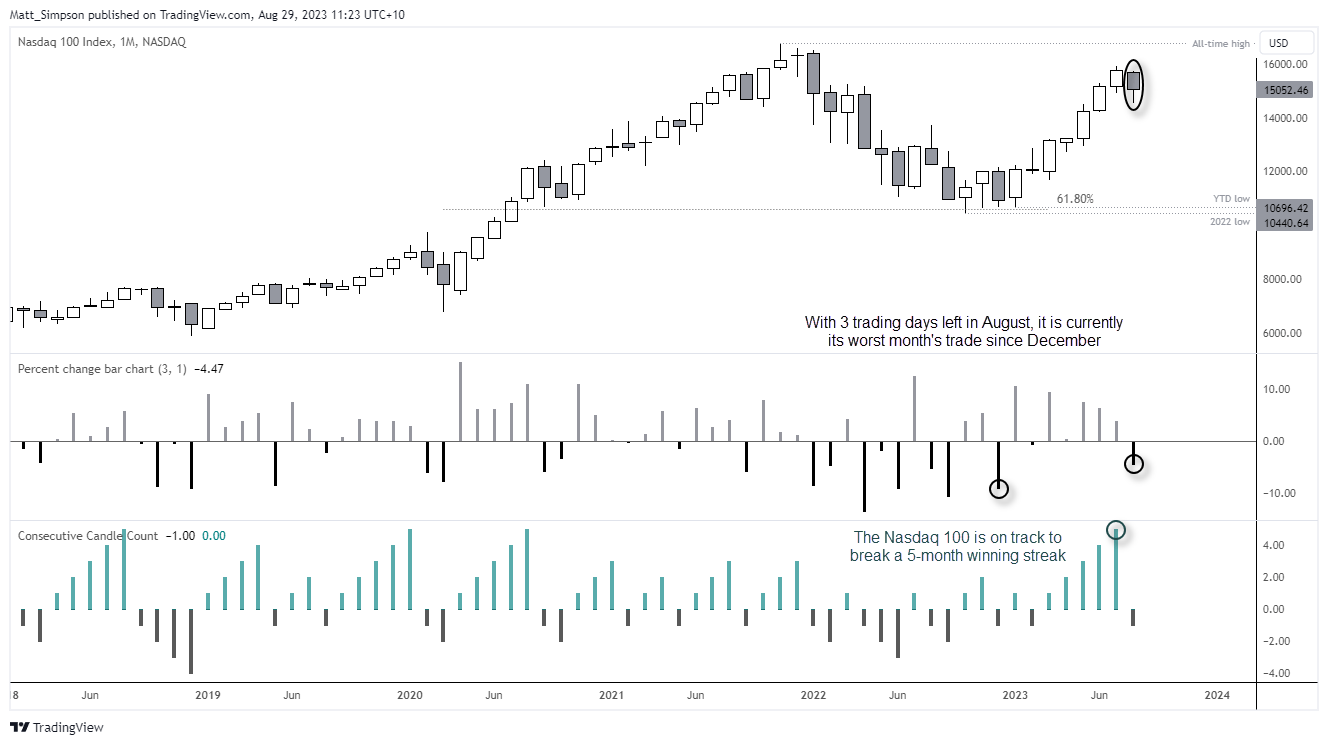
As things stand, the Nasdaq 100 is on track for its worst month since December. And unless it can rally 4.4% or more over the next three days, it will snap a 5-month bullish streak. The fact that momentum turned lower before it could reach 16,000 shows there is no immediate appetite to retest its all-time high set in November 2021. And it also raises the question as to whether this is the beginning of a larger correction.
And it wouldn’t be the end of the world if it pulls back further, given the Nasdaq 100 has risen nearly 50% from the January low. But as corrections tend to display different price action characteristics to that of a trend, it can at least be beneficial to be prepared for a possible switch in market behaviour. Besides, we’re also about to enter the month of September – the only month of the year that has averaged negative returns over the past 38 years.
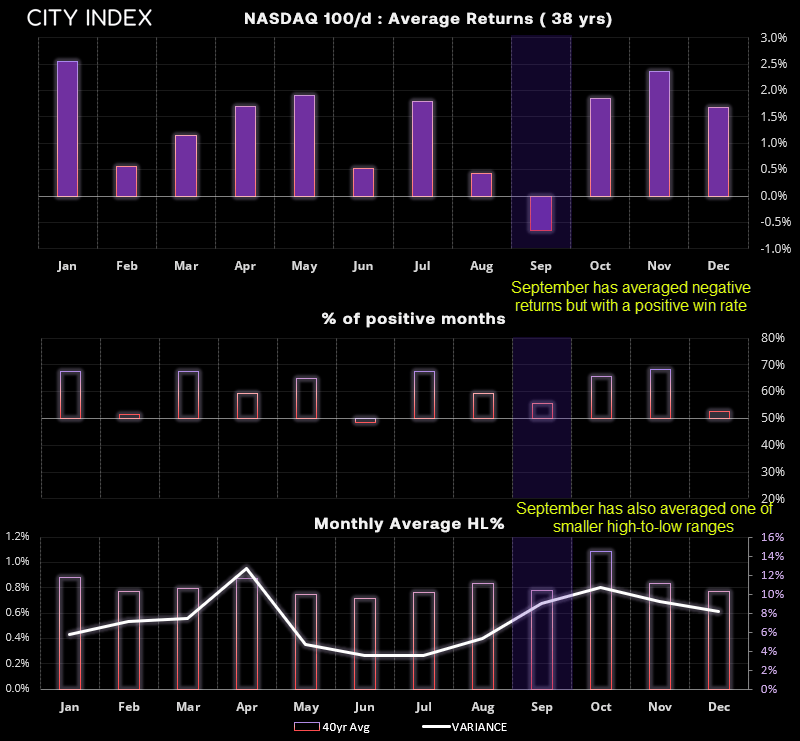
Nasdaq 100 seasonality
Over the past 30 years, the Nasdaq 100 has averaged a negative return of -0.65% in September, which makes it the only bearish month over that timeframe. Yet it also has a positive win rate of 55.6%, which indicates that a select few bearish months have skewed the results. Of course, this lookback period includes the bursting of the Nasdaq bubble which saw the index fall -12.4% in September 2000, -20.5% in 2001 and -11.7% in 2022. The Nasdaq also fell in September 2022 by -10.6%. And if these ‘outlier’ months are removed, the average return in September becomes 0.95%.
Either way, with a lower high-to-low range in September and lack of obvious catalyst to pump up volatility, we should be on guard for a choppy month’s trade in September 2023. And that leaves traders with a choice between referring to lower timeframes to trade, or simply stepping aside until momentum provides clearer clues on the daily timeframe.
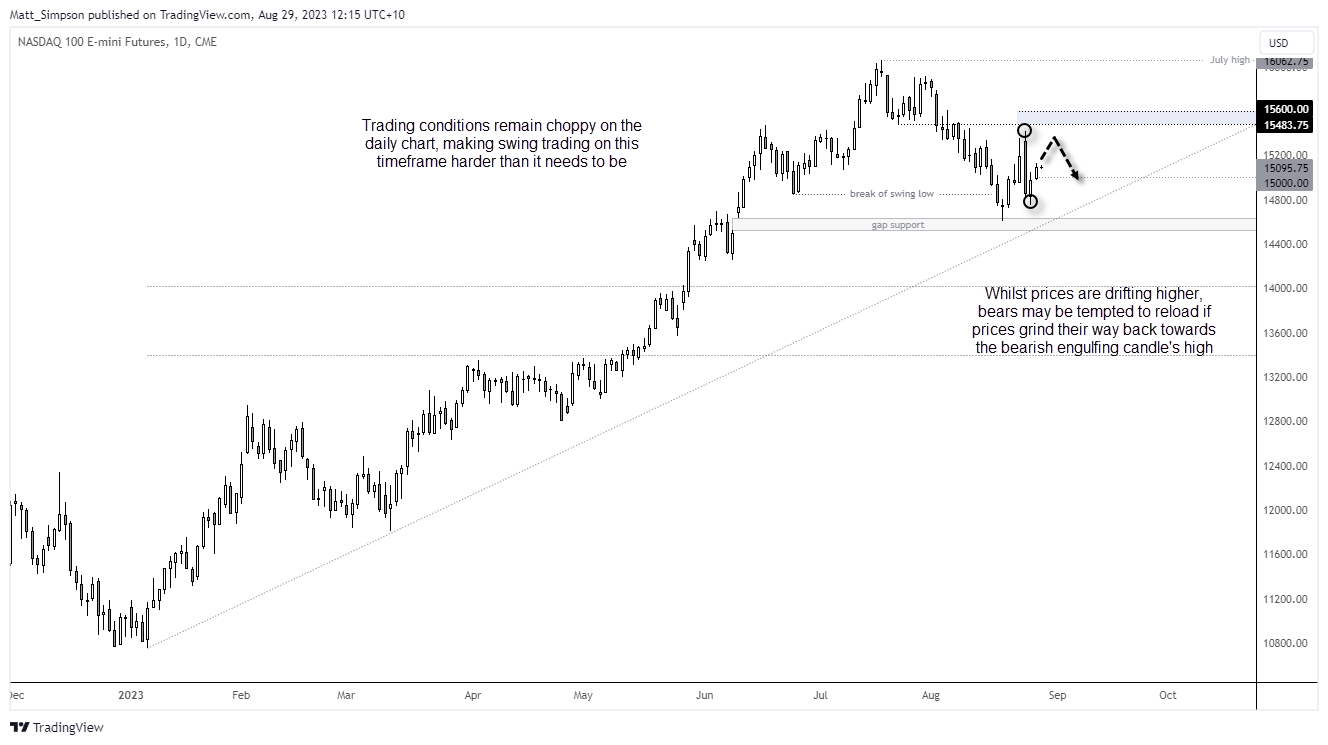
Nasdaq 100 technical analysis (daily chart)
We can see on the daily chart that the decline from the July high found support in the June 9 gap. While prices rebounded towards 15,400, they did not quite reach the 15,483 – 15,600 pivotal zone flagged in last week’s analysis. Instead, a bearish engulfing day formed.
And this is where it gets tricky: we have a large bearish candle in the middle of the 14,600 – 15,600 range. Yes, the market has printed a higher low on the daily chart, but the bearish engulfing candle is killing sentiment and prices are being allowed to drift higher at best. And while volatility remains low, any move towards the bearish engulfing / 15,400 level may tempt bears to re-enter and try to force prices lower.
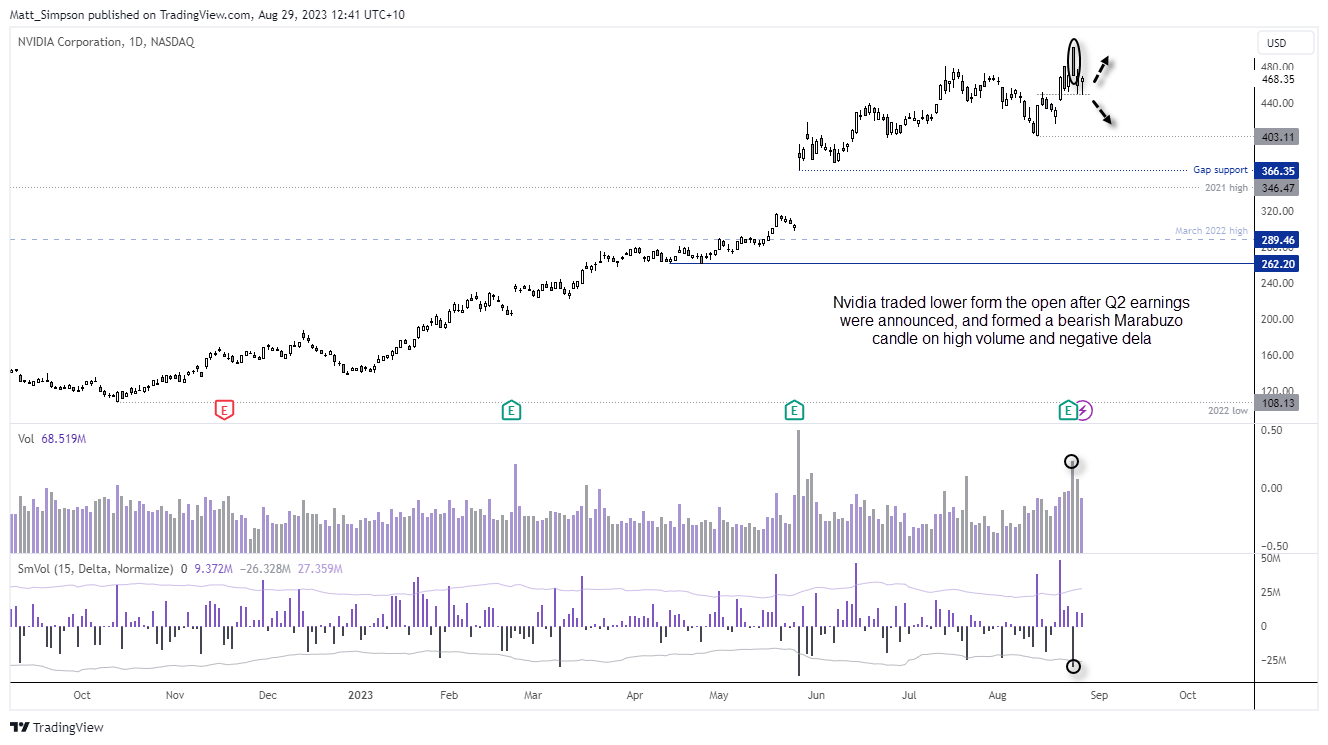
Nvidia (NVDA) technical analysis (daily chart):
To underscore the lack of direction we are seeing on the Nasdaq, let's take a look at the Nasdaq's best performer YTD (up 215% this year alone). While the daily chart shows an established uptrend, the characteristics of price action have changed. The days of relatively small ranges and advancing prices seen in H1 are gone, replaced by large ranging days in an almost haphazard price delivery over the past six days.
Note that all gains from the Q2 earnings blowout have evaporated, and that the trading day following earnings formed a bearish Marubozu candle on high volume and notably negative delta (significantly more bearish trades than bullish ones). The market is trying to form a base above 440, but unless we receive a bullish catalyst, it seems to be a coin flip as to whether prices can rally from that level or break beneath it.
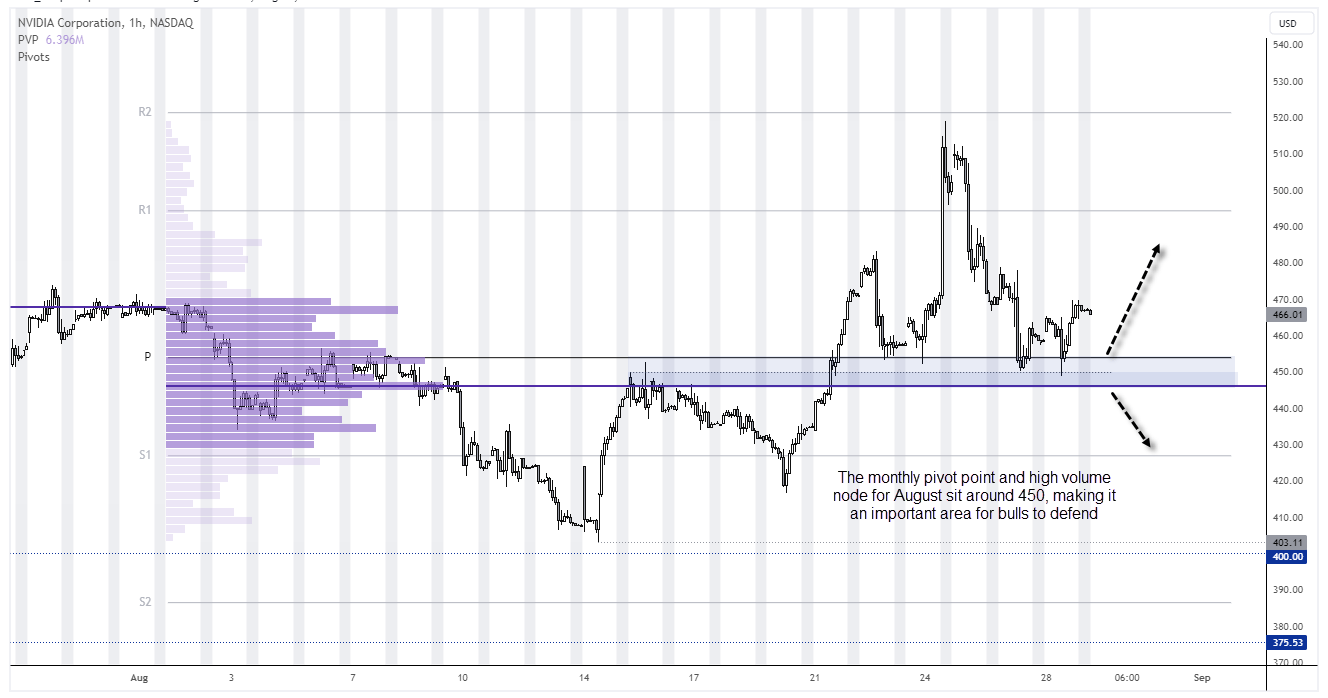
Nvidia (NVDA) technical analysis (1-hour chart):
The hourly chart really emphasises how important the 450 area is, as it also has the monthly pivot point and VPOC for August (volume point of control – the most heavily traded price by volume). Therefore, if prices pull back towards this support zone, bulls could seek evidence of a swing low for a near-term swing trade to the long side. Whereas a break beneath it brings the 430 handle into focus, the near the monthly S1 pivot.
But with trading conditions now on the choppy side, traders may want to remain nimble with wider stops and shorter profit objectives.
-- Written by Matt Simpson
Follow Matt on Twitter @cLeverEdge
How to trade with City Index
You can trade with City Index by following these four easy steps:
-
Open an account, or log in if you’re already a customer
• Open an account in the UK
• Open an account in Australia
• Open an account in Singapore
- Search for the market you want to trade in our award-winning platform
- Choose your position and size, and your stop and limit levels
- Place the trade
Latest market news
Yesterday 01:32 PM
Yesterday 09:35 AM
Yesterday 07:23 AM
Yesterday 04:48 AM
Yesterday 12:17 AM
July 25, 2024 10:39 PM
Latest Trade Ideas articles

Yesterday 09:35 AM

Yesterday 12:17 AM

July 25, 2024 10:39 PM

July 25, 2024 05:30 PM