


Few sectors demonstrate the extreme boom-bust nature of investing during the pandemic era than lithium. Anyone who got involved over the past three years would know it’s been a wild ride.
On the back of bullish forecasts for battery demand and a sharp increase in disposable income for many households, investors flocked to lithium in droves, resulting in some mind-boggling gains, especially in individual names. But they evaporated as quickly as they occurred, undermined by inflation, higher interest rates and many investors simply having to return to work.
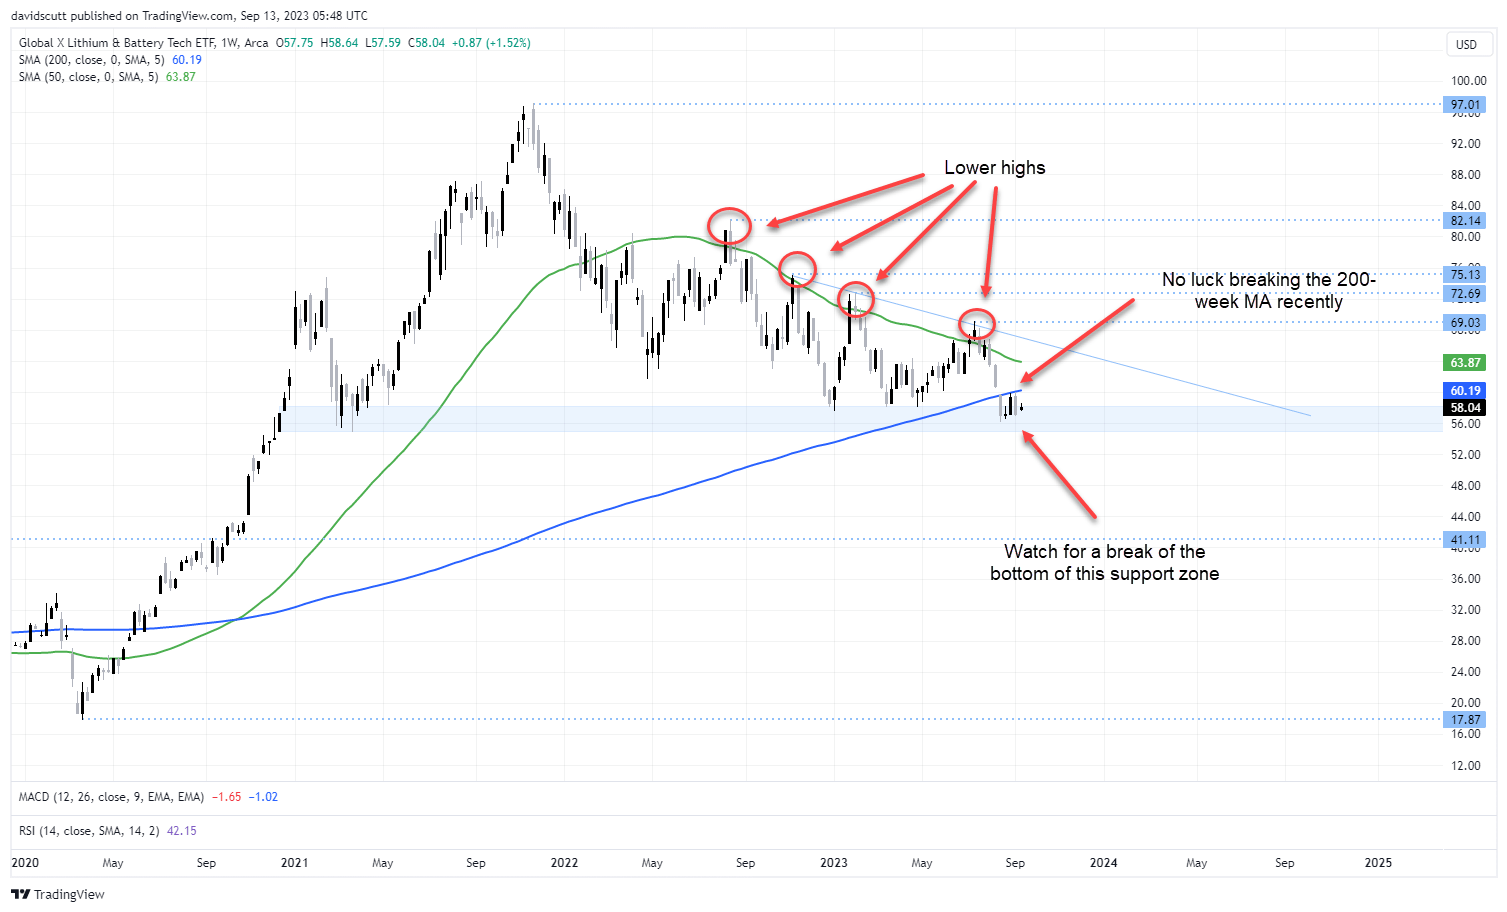
Global X Lithium (LIT) ETF remains in bear market
As a basket of lithium-aligned stocks ranging from upstream producers through to auto manufacturers such as Tesla, the Global X Lithium (LIT) ETF shows the enormity of the cycle, largely reflecting the long duration nature of its components, making valuations sensitive to movements in long bond yields as expected cashflows in the future are discounted.
Given what’s happened with bond yields recently, it’s no surprise the ETF has struggled over the past year, logging four lower highs in succession on the weekly, leaving it at the lowest level since early 2021.
But for all the doom and gloom surrounding falling lithium prices and concerns about end-user demand, LIT has held up on the charts, continuing to attract bids at what looks to be a strong demand zone dating back to late 2020. But sitting in a descending triangle, with the 50-week MA edging closer to cross the 200-week equivalent from above, and with MACD and RSI not looking flash either, the outlook still looks anything but rosy.
Bond yield breakout creates risks for long duration investments
As mentioned above, what happens next with bond yields may play a key role in determining what happens next for the LIT ETF. On that front, with US CPI out later today and the FOMC meeting arriving next week, we have a couple of big market events that may provide the answer.
The bottom of the support zone on the LIT weekly chart is located at $55. If that were to give way, there’s not a lot of visible support until we hit the 2018 high just above $41. On the topside, it has failed at the 200-week MA on several occasions over the past month, suggesting a stop above that level – currently around $60 – may be appropriate for those seeking to go short.
-- Written by David Scutt
Follow David on Twitter @scutty
How to trade with City Index
You can trade with City Index by following these four easy steps:
-
Open an account, or log in if you’re already a customer
• Open an account in the UK
• Open an account in Australia
• Open an account in Singapore
- Search for the market you want to trade in our award-winning platform
- Choose your position and size, and your stop and limit levels
- Place the trade
Latest market news
Yesterday 01:32 PM
Yesterday 09:35 AM
Yesterday 07:23 AM
Yesterday 04:48 AM
Yesterday 12:17 AM
July 25, 2024 10:39 PM
Latest Global X Lithium ETF articles

September 26, 2023 02:27 AM

Yesterday 01:32 PM

Yesterday 09:35 AM

Yesterday 07:23 AM