


December 7, 2021 8:40 AM

According to FTSE Russell, “the Russell 2000 Index is constructed to provide a comprehensive, unbiased barometer of the small cap segment of the US equity markets. It is a subset of the Russell 3000, that includes approximately 2000 of the smallest securities based on a combination of their market cap and current index membership.” Small capitalized stocks tend to have higher beta, which measures a stock’s volatility. Therefore, it is best to actively manage these stocks. However, when in an index of 2000 stocks, the volatility tends to be consistent with that of overall markets.
Trade The Russell 2000: Login or Open a new account!
• Open an account in the UK
• Open an account in Australia
• Open an account in Singapore
The US Small Cap 2000, or the Russell 2000, has had a tough time trending higher this year! As the larger cap S&P 500 and NASDAQ 100 were grinding higher, the smaller cap stock index was trading sideways. On January 7th the low was 2059.33. The index traded in a range between there and 2360.16 for nearly the next 10 months before breaking above the channel on November 3rd. The index made an all-time high on November 8th at 2458.85, however failed to continue higher and has since pulled back into the channel. The candlestick at those high on the daily timeframe was a shooting star, an indication of a possible reversal.
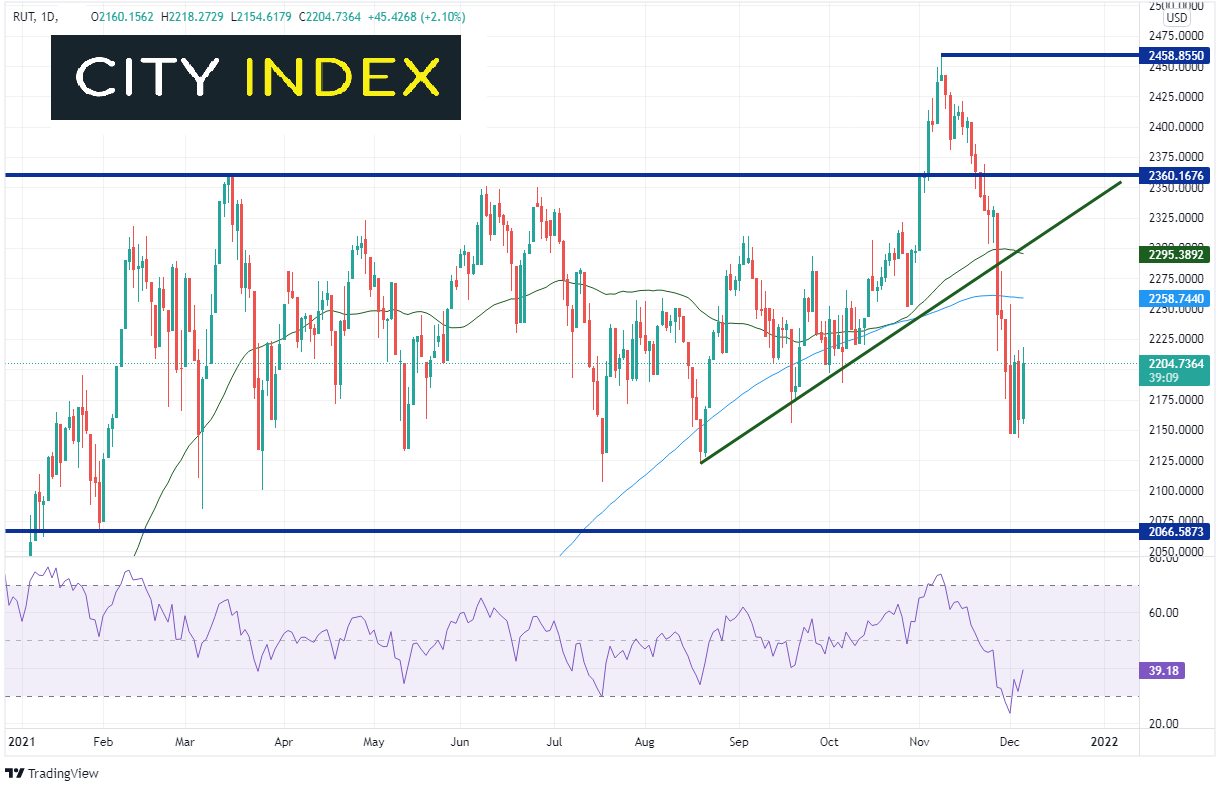
Source: Tradingview, Stone X
On a 240-minute chart, the Russell 2000 has paused between roughly 2140 and 2217, as the RSI moves from oversold territory back to neutral. In doing so, price has formed a potential flag pattern. The target for a flag pattern is the distance of the length of the pole added to the breakdown point of the flag. In this case the target would be near 1900, which is near its 1-year lows! However, the small cap index must first break through the bottom trendline of the flag near 2160. Horizontal support below there is near 2120 and then the bottom of the channel near 2066.58. Resistance above is at the upper trendline of the flag near 2225 and then the 200- and 50- Day Moving Averages (on the daily timeframe) at 2258.74 and 2295.38, respectively.
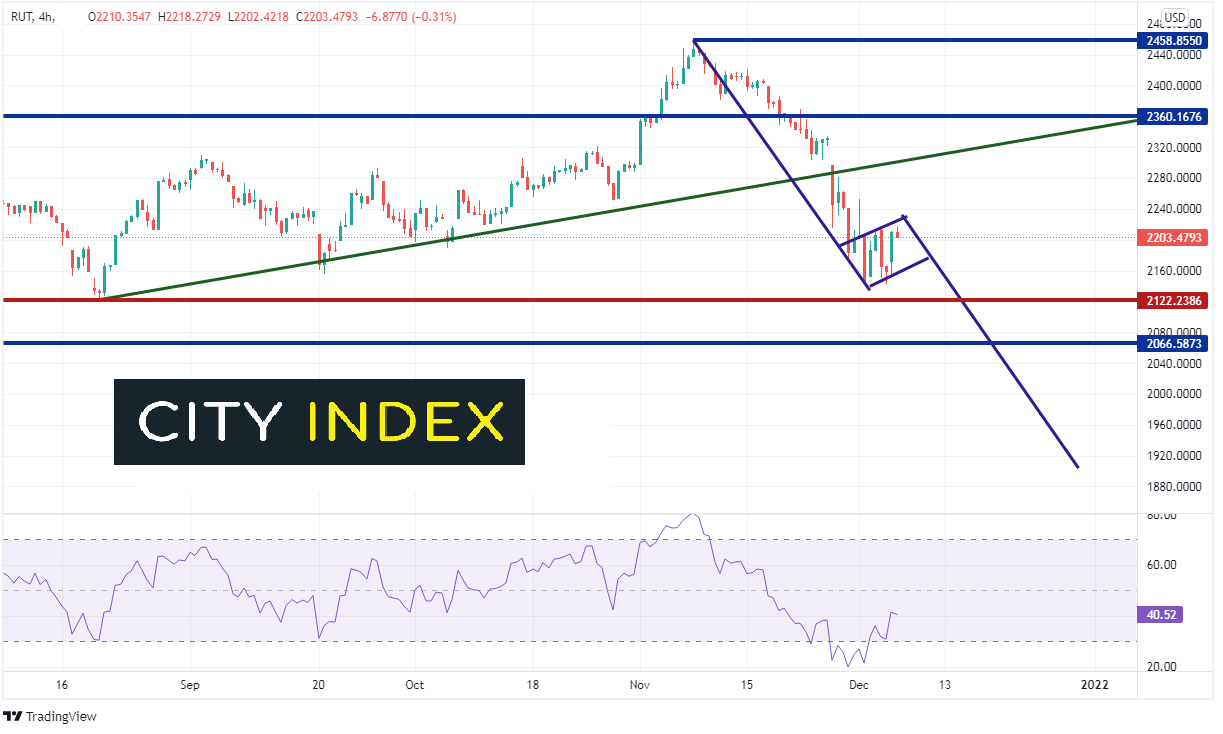
Source: Tradingview, Stone X
Price in the Russell 2000 failed to maintain its momentum above the top trendline of the sideways channel and pulled back in dramatic fashion. If price breaks below the flag formation, it could be on its way to the target near 1900, perhaps even by the end of the year!
Learn more about equity trading opportunities.
Latest market news
Yesterday 01:32 PM
Yesterday 09:35 AM
Yesterday 07:23 AM
Yesterday 04:48 AM
Yesterday 12:17 AM
July 25, 2024 10:39 PM
Latest Trade Ideas articles

Yesterday 09:35 AM

Yesterday 12:17 AM

July 25, 2024 10:39 PM

July 25, 2024 05:30 PM