


S&P 500:
US indices have continued to defy gravity, although their performance last week was varied. The Dow Jones effectively moved sideways in a choppy range and did not outperform its peers as we had anticipated. The Nasdaq 100 has paused around its 200-day eMA and printed an indecision candle on Friday. Daily trading volumes moved lower each day last week and was below its 20-day MA, and that is not a sign of strength for the rally.
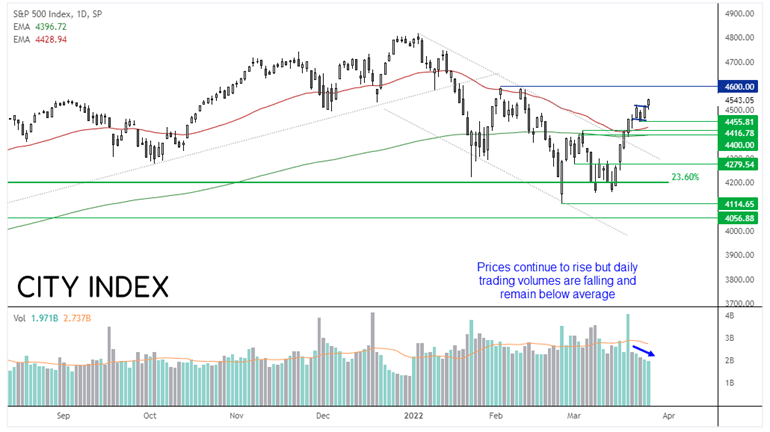
Ultimately, prices are rising and, until we see a bearish candle on strong volume, prices can continue to move higher. We remain bullish on the index but cautiously so, and not looking for a large bullish move from current levels. 4600 is its next target whilst prices hold above 4455, but we’d really like to see volumes increase whilst prices rise before expecting a break above 4600, as it would show fresh buyers supporting the market.
Hang Seng:
The Hang Seng couldn’t quite reach our 22,600 target before reversing lower. However, it did rally nearly 23% from this month’s low (which had a V-bottom) which means it has entered a technical bull market. Prices are holding above the March 2020 low so we’re keen to see if support can be found and momentum moves prices back towards the May 2020 low around 22,400. But we would need to see a break above 22,665 before we can be more confident that it really is in a bull market.
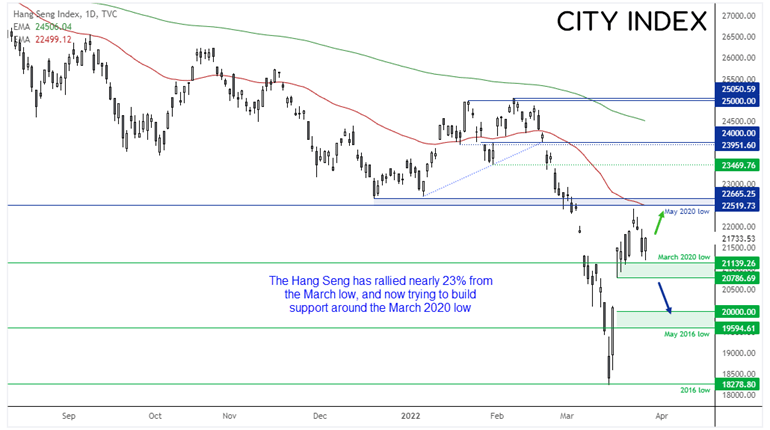
But with news that Shanghai is going into lockdown for mass COVID-testing of its residents, sentiment is a tad fragile. So we should also be on guard for a break beneath 22,786 and potential move back to 2,000.
Nikkei futures positioning (priced in yen):
Traders reverted to net-long exposure to Nikkei futures for the first time 11-weeks, according to the Commitment of Traders Report (COT). However, is only by 207 contracts and both gross shorts and long rose last week, so we could effectively say that buyers and sellers are balanced despite the rise in prices.
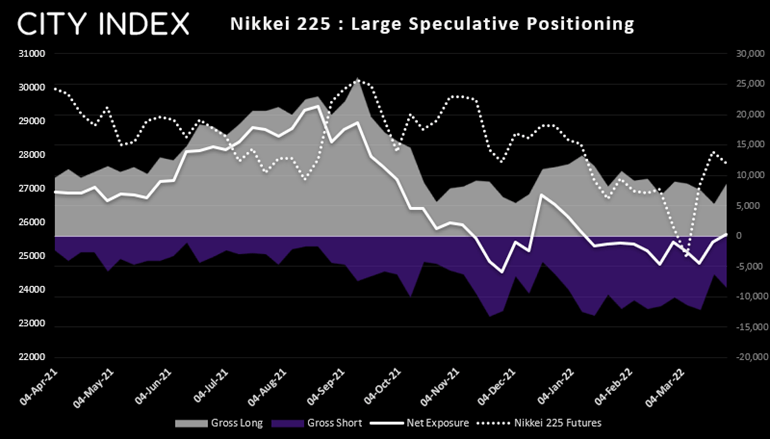
Foreign investors were net-sellers of Japan’s stock markets for an eight consecutive week. However, the rate of change was lower so perhaps the worst of the selling is behind us. And now the Nikkei has risen to a 2-month high it will likely tempt bullish investors back to the table, so perhaps they’;; be net buyers by the next report.
Nikkei 225 index:
The Nikkei has rallied an impressive 14% from the March low and reached our target at 28,000 which we mentioned in last week’s report. However, the rally has stalled at trend resistance, so the index now needs to decide on whether it will break the trendline or pull back further from it.
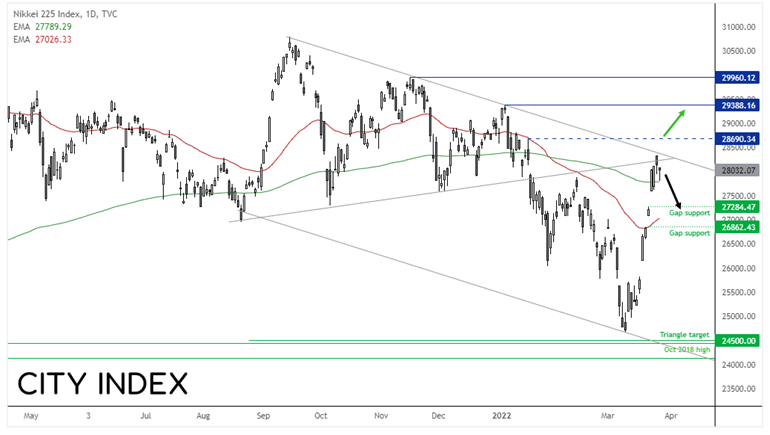
A 2-day pullback has seen prices fall to the 200-day eMA, which is a potential level of support this week. If prices instead break lower then a near-term bearish target is the lows of the gap around 27,284, where we’d then seek evidence of a swing low in anticipation of its next leg higher. A break above 28,690 would instil confidence that its bullish trend has entered its next phase.
Read our Nikkei 225 trading guide
How to trade with City Index
You can easily trade with City Index by using these four easy steps:
-
Open an account, or log in if you’re already a customer
• Open an account in the UK
• Open an account in Australia
• Open an account in Singapore
- Search for the company you want to trade in our award-winning platform
- Choose your position and size, and your stop and limit levels
- Place the trade
Latest market news
Yesterday 01:32 PM
Yesterday 09:35 AM
Yesterday 07:23 AM
Yesterday 04:48 AM
Yesterday 12:17 AM
July 25, 2024 10:39 PM
Latest Hong Kong 50 articles

June 5, 2024 02:16 AM

October 26, 2022 12:38 AM
October 26, 2022 12:38 AM

September 6, 2022 12:21 AM