


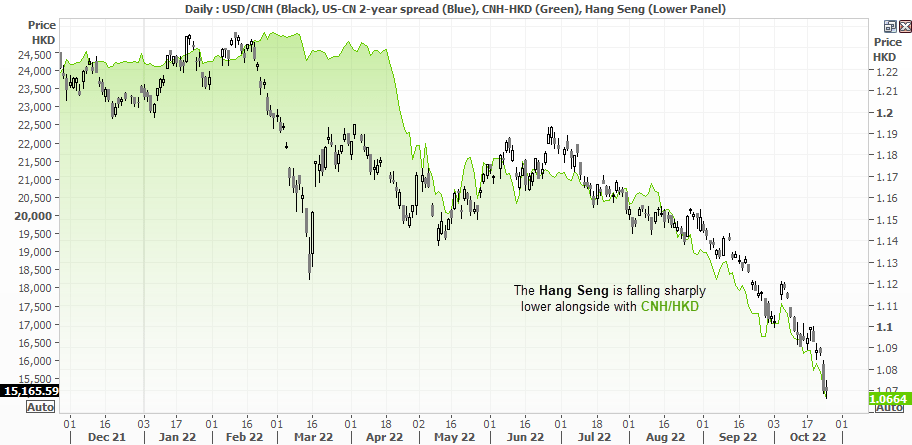
With President Xi securing a third term and refusing to back away from the COVID-zero strategy, it has further fanned fears of a global recession as China’s growth is likely to suffer as a consequence. This has seen the Chinese currency continue to move lower against the US dollar and propelled USD/CNH to a record higher. And not wanting to miss out on the action, the Hang Seng touched a fresh 13-year low yesterday.
Whilst the yuan has fallen sharply against the US dollar, its depreciation is broad based. This month alone the yuan has lower against the Korean Won, Indian and Indonesian Rupee, Australian dollar and Hong Kong dollars (to name a few). The power that be in China are presumably happy to let their currency slide to boost exports and therefore growth. The trouble is that they are not alone with that idea, with the Bank of Japan (BOJ) being more than vocal with their desire for a weaker currency. But, for now, their intentions seem clear; China wants a weaker currency.
The Hang Seng has become collateral damage as it gets dragged lower with the CNY/HKD exchange rate. But fear not, as China’s ‘plunge protection team’ (PPT) were rumoured to be at work yesterday by purchasing securities to stimmy the stock market decline. The market may have closed below 15,000 for the first time since 2009, but downside volatility was notably lower than the days preceding it. I wouldn’t want to be a buyer at these lows, but with PPT at work I would be wary of shorts around current levels without a retracement higher.
It’s hard to construct a bearish case for USD/CNH, given the current drivers
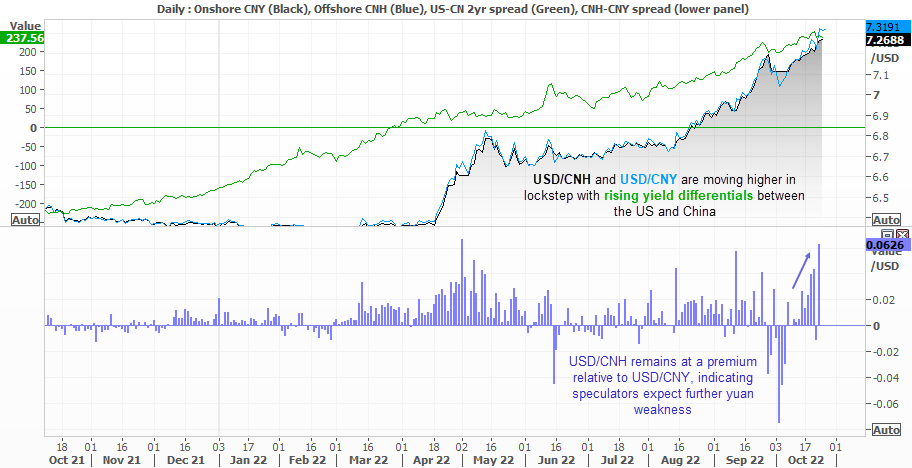
Overall, it appears that the yuan is more likely to weaken against the US dollar than reverse its trend. Markets rarely move in a straight line, even though USD/CNH has most certainly tried to in recent months. Offshore yuan (CNH) is trading below onshore yuan (CNY) which shows speculators continue to expect the onshore yuan to depreciate against the US dollar. Furthermore, rising yield differentials between US and CN are moving higher in lockstep with USD/CNH as the Fed remains on an aggressive tightening cycle and the dollar screams higher. Therefore, whilst these drivers remain in place and China are happy to let their currency slide, the bias for USD/CNH remains bullish.
Still, no trend lasts forever
A development worth keeping tabs on is the excitement that the Fed may step off the gas and hike at a slower pace, which brings us closer to this famous ‘Fed Pivot’. The US dollar and yields were lower yesterday following weak consumer sentiment, manufacturing and house data – which means there’s less pressure for the Fed to hike in 75bp chunks.
As we head into 2023 the odds of the US dollar topping out seem higher, given the Fed can’t hike forever and the dollar has had broad-based rally this year. And as noted two weeks ago, the US dollar index annual rate is over +2 standard deviations – a level which tends to lead to some mean reversion.
So if or when we get the Fed pivot, the dollar could become the currency of choice to ‘throw overboard’ as bulls book profits and bears trade against it. And if China were to reverse their zero-COVID policy, a bearish case for USD/CNH becomes compelling.
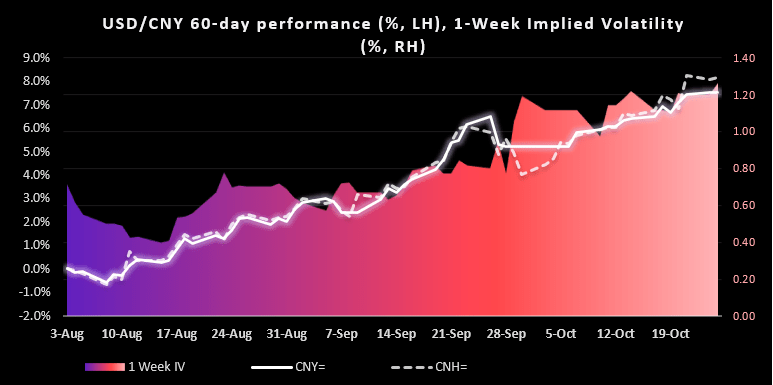
1-week implied volatility for the yuan is on the rise
However, 1-week implied volatility (IV) has spiked higher and trades at a premium to the 2-week IV and beyond. Clearly, options traders are concerned over the near-term and that leaves the potential for larger swings than usually expected, in either direction.
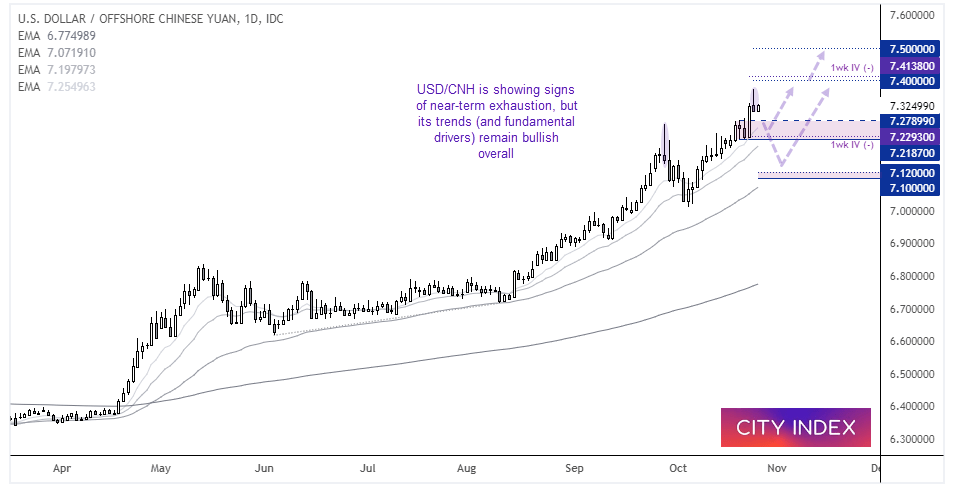
USD/CNH daily chart
A bearish hammer formed on the USD/CNH daily chart yesterday – a pattern which last seen on the 28th of September marked the beginning of a retracement. That correction lasted a whole five days and retraced around 3.5% which, if repeated, could see the pair pull back to the 7.1200 area.
Using a more conservative approach, perhaps prices pull back towards the 7.218 low which is near the 1-week implied volatility downside estimate. A break below this support level likely marks a deeper correction, but for now I suspect bulls would be interested in buying dips above it.
7.4000 is the next key level for bulls to focus on, which sits near the 1-week implied volatility upside estimate.
How to trade with City Index
You can easily trade with City Index by using these four easy steps:
-
Open an account, or log in if you’re already a customer
• Open an account in the UK
• Open an account in Australia
• Open an account in Singapore
- Search for the company you want to trade in our award-winning platform
- Choose your position and size, and your stop and limit levels
- Place the trade