


- Gold analysis: Metals makes sluggish start to a busy week
- BOJ, ECB and US GDP among macro highlights
- Gold technical analysis suggests metal is in crossroads
Today saw US equity markets hit fresh highs, crude oil recovered from early weakness and safe-haven gold remained out of favour. The risks to global supplies driven by tensions and violence in the Middle East continue to provide support for oil on the dips. But we are also in a positive risk environment, with three major US indices all breaking to fresh unchartered territories today as the tech-fuelled rally continues. The positive risk sentiment from equity markets is also helping to boost the appetite for other risk assets, including crude oil, but discouraging investors from gold, which nevertheless remains on track to potentially gain more ground once the hawkish repricing of Fed rate cuts is completed.
Gold makes sluggish start to a busy week
Despite recovering in the last two days of last week, gold still finished the week lower. It is still in the red for January and thus for the year. Its weak performance is in a sharp contrast to how it had ended last year, scoring a hattrick of monthly gains in Q4. Investors were expecting the Fed might cut interest rates sooner than it had planned. This year, those expectations have been pushed back thanks to strong data and hawkish Fed commentary, and so gold has dropped back a little as yields went up. A few weeks back, everyone thought a rate cut in March was a sure thing. Now, it's a toss-up, according to the CME's FedWatch tool.
The Fed's expected rate cuts have been pushed back due to strong data and some tough talk from Fed against expectations of a major dovish tilt. Surprisingly, this hasn't stopped stocks from hitting new highs, especially in the tech sector. Obviously, there are other factors at play. But it does suggest that gold might be able to regain its poise as well, especially as it hasn’t lost too much ground.
So, there's a good chance we might see gold's bullish trend pick up again once the Fed's rate cut expectations settle. But I'm not jumping the gun. I'll wait for the charts to give a solid bullish signal before considering long setups, especially with central bank officials pushing back on rate cuts.
Gold analysis: What are traders focusing on this week?
FX markets, gold and equity investors will be expecting heightened volatility this week as we have a couple of central bank meetings, namely the Bank of Japan and European Central Bank, and some top tier data from the US.
- BOJ interest rate decision
Tuesday, January 23
The BoJ is not likely to alter its policy at this meeting, but may do so at some point in this first half of the year. Recent data releases from Japan will give them very little incentive to make any changes to current settings, with inflation and ages data both remaining soft. If the BoJ turns out to be even more dovish than expected then this may provide some support for gold, while any concrete signals that it will end negative interest rates then that would likely have negative impact on gold as Japanese government bond yield rise.
- Manufacturing PMIs
Wednesday, January 24
This Wednesday's global PMIs will give us a glimpse into the world economy's condition as the year kicks off. Traders could use these as a gauge for demand across various commodities. Worries about the Chinese and European economies have been a drag on commodities and indices heavy on commodities, like the FTSE 100 and China A50. On the flip side, tech-focused indices such as Nasdaq 100 have done well, betting that the global slowdown will prompt significant interest rate cuts. Base metals, including copper, have struggled, affecting silver and, to a lesser extent, gold. Let's see what purchasing managers in manufacturing and services report for the start of the year. PMIs are seen as leading indicators and carry more weight for investors. A positive response in risk assets could boost foreign currencies against the dollar, providing support for gold.
- ECB rate decision
Thursday, January 25
The upcoming ECB rate decision might impact gold. If the ECB turns out to be more dovish than expected, it could lead to a slip in European bond yields, providing support for assets like gold and silver with low or zero yields. However, the market is currently anticipating a hawkish stance from the ECB, as indicated by several officials attempting to resist early rate cuts, similar to the Fed's approach. Unlike the US, where the pushback is mainly due to a relatively stronger economy, here it is more to do with concerns about inflation persisting in the UK and Eurozone, thanks in part to elevated wage pressures. ECB President Christine Lagarde hinted at a potential reduction in borrowing costs in the summer rather than the spring, echoing worries about wage inflation expressed by other ECB officials. Let's see if the ECB offers further clues in this meeting.
- US GDP and PCE inflation
Thursday and Friday, January 25/26
Gold, being a dollar-based asset, is likely to be more affected by upcoming US data than anything else. Recent robust reports on CPI, jobs, and retail sales have boosted the dollar, putting pressure on gold prices. If GDP data shows continued strength in the US economy, expectations for an imminent interest rate reduction will be pushed back further. Gold enthusiasts will be on the lookout for weaknesses in US data, including Thursday's GDP report and the Core PCE data the next day.

Gold technical analysis
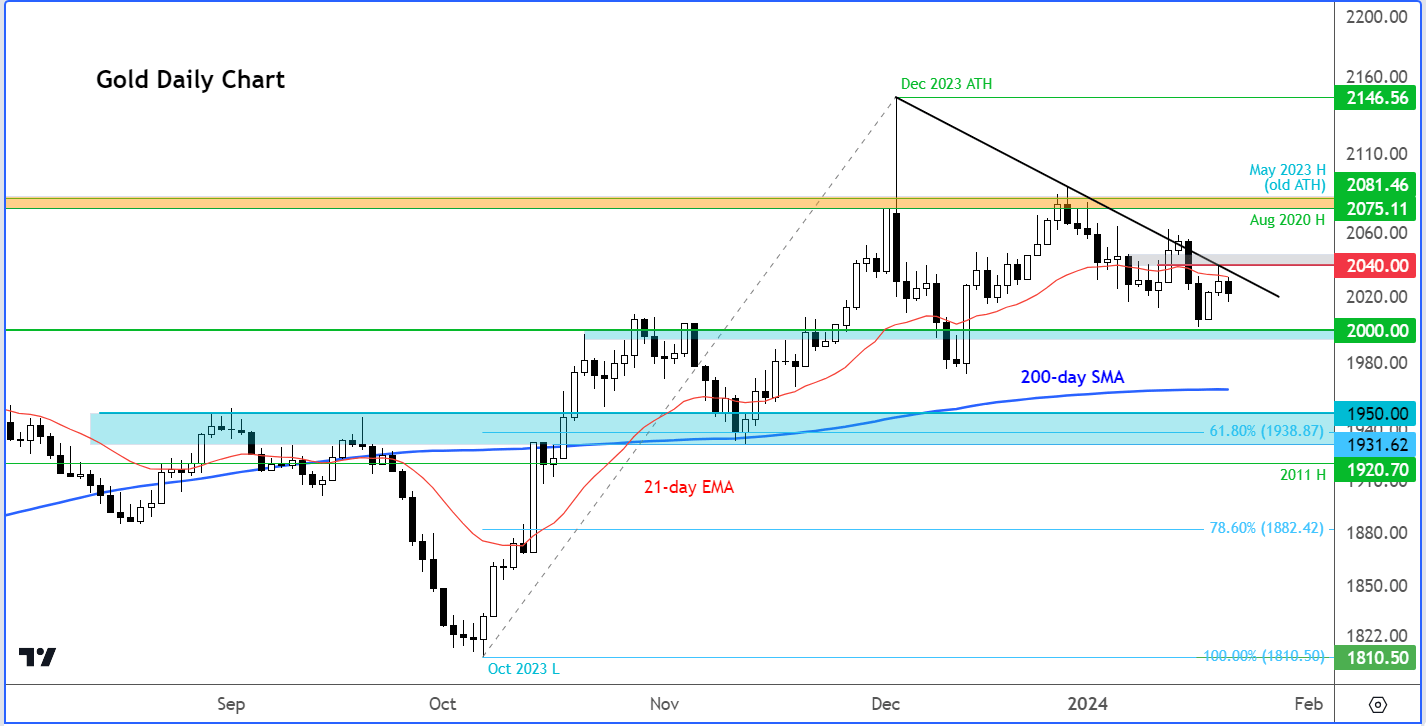
Source: TradingView.com
Gold finds itself at a crossroads, and its short-term direction will become clearer with either a breakthrough above the short-term bearish trendline around the $2040 mark (indicating a bullish trend) or a decisive drop below the crucial horizontal support at approximately $2000 (suggesting a bearish move).
Despite its recent struggles, the overall trend remains bullish when you overlook the recent price movements. Since hitting a low of $1810 in October, gold has established several higher lows and a couple of higher highs, including a fresh record high in December. The metal surpassed its 200-day moving average in mid-October and has maintained its position above it.
A successful breach of the short-term bearish trendline could trigger fresh technical buying, with a target set above the $2040-$2045 range. The recent high at around $2062 becomes a key objective for bullish trades. A potential move beyond this level may lead to a rally toward the next resistance zone between $2075 and $2080. Beyond that, there are no significant reference points until the peak in December at $2146.
On the downside, a clean break of support around $2000 might lead to a dop back to the 200-day MA at $1964. If the price falls below the 200-day MA, the next potential support zone lies between $1930 and $1950, where the 61.8% Fibonacci retracement aligns with prior support and resistance levels, making it a crucial area for the bulls to defend.
-- Written by Fawad Razaqzada, Market Analyst
Follow Fawad on Twitter @Trader_F_R
How to trade with City Index
You can trade with City Index by following these four easy steps:
-
Open an account, or log in if you’re already a customer
• Open an account in the UK
• Open an account in Australia
• Open an account in Singapore
- Search for the company you want to trade in our award-winning platform
- Choose your position and size, and your stop and limit levels
- Place the trade
Latest market news
Yesterday 01:32 PM
Yesterday 09:35 AM
Yesterday 07:23 AM
Yesterday 04:48 AM
Yesterday 12:17 AM
July 25, 2024 10:39 PM
Latest Trade Ideas articles

Yesterday 09:35 AM

Yesterday 12:17 AM

July 25, 2024 10:39 PM

July 25, 2024 05:30 PM