


- Gold analysis: Bears in charge amid hot CPI, hawkish Fed
- US CPI prints 3.1% with core CPI remaining unchanged at 3.9%
- Gold technical analysis point to a potential drop towards 200-day MA
Gold, bonds and stocks drop as core inflation remains at 3.9%
In the immediate aftermath of a strong US inflation report, the US dollar rallied and down went everything else, including bonds, gold and stocks. The hotter CPI print once again disappointed those who had expected US data to come in weaker and encourage the Fed to opt for an earlier rate cut. But with a headline inflation print of 3.1% and core reading of 3.9%, the Fed will have no choice but to maintain a hawkish rhetoric for a while yet. Consequently, the dollar’s bullish momentum may well continue, and yields remain elevated for a while yet. This argues against a quick gold recovery in the short-term outlook, even if the long-term picture remains as bullish as ever.
In case you missed it, US CPI printed +3.1% vs. +2.9 % eyed and +3.4% last, with core CPI coming in unchanged at +3.9% vs. +3.7% expected.
This week's other notable US data includes retail sales, industrial production, jobless claims, and Manufacturing indices from Philadelphia and New York, all scheduled for Thursday, preceding PPI, building permits, and UoM Consumer Sentiment on Friday. If this week's upcoming data, especially retail sales, continue to showcase economic resilience in the US, it is likely to bolster the US dollar further and hurt gold.
Gold analysis: What does the hot CPI report mean for metal prices?
There are no obvious reasons for investors to start selling the US dollar, other than the fact some of the stronger foreign currencies are beginning to look quite attractive again after a multi-week dollar rally. Still, with most major central banks appearing to be in no rush to lower interest rates, not least the Fed, BoE or ECB, and given the sticky inflation and continued strength we have seen in other US data of late, including that strong jobs report at the beginning of the month, talks of an early rate cut have all but ended.
Recently Fed Chair Powell had said that the “danger of moving too soon is that the job’s not quite done, and that the really good readings we’ve had for the last six months somehow turn out not to be a true indicator of where inflation’s heading.” He mentioned that time that “the prudent thing to do is to, is to just give it some time and see that the data continue to confirm that inflation is moving down to 2% in a sustainable way.”
Based on today’s inflation report, it looks like the Fed Chair was spot on for being cautious. More evidence is definitely needed before they can confidently say that inflation is heading to 2% in a sustainable way.

Gold analysis: Technical levels to watch
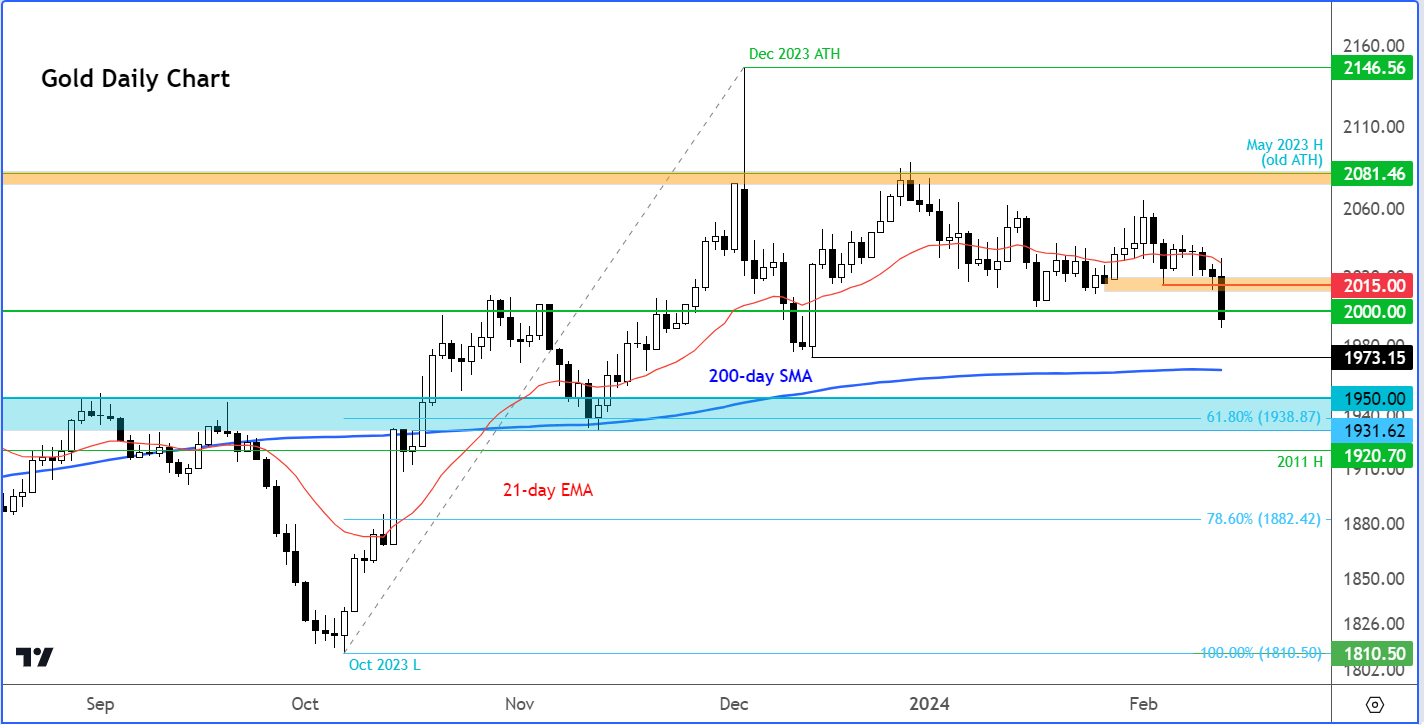
Source: TradingView.com
The latest selling means more short-term support levels have broken down on gold chart, increasing the bear’s hold of price action. At the time of writing, gold was holding below $2000, a psychologically-important level. If there appears to be acceptance below this level, then watch out for a potential drop to probe liquidity below the December low at $1973 next. Below that level, we have the 200-day average coming in at $1965.
On the upside, resistance is now seen around $2010-$2015 area, which had been support until today’s breakdown.
The bulls will have to remain patient now and await a fresh ‘buy’ signal in light of the fresh breakdown we have observed today. This could take a while to form given the recent moves in the bond markets, and all the other macro factors I mentioned above.
So, as before, I would continue to favour looking for downside in gold in the short-term outlook, until such a time that the dollar starts looking heavy again.
-- Written by Fawad Razaqzada, Market Analyst
Follow Fawad on Twitter @Trader_F_R
How to trade with City Index
You can trade with City Index by following these four easy steps:
-
Open an account, or log in if you’re already a customer
• Open an account in the UK
• Open an account in Australia
• Open an account in Singapore
- Search for the company you want to trade in our award-winning platform
- Choose your position and size, and your stop and limit levels
- Place the trade
Latest market news
Yesterday 06:37 AM
April 26, 2024 01:25 PM
Latest Gold articles

April 1, 2024 01:09 PM

March 28, 2024 10:30 AM

March 26, 2024 11:24 PM

March 26, 2024 12:00 PM