


February 3, 2022 10:01 AM

On November 10th, 2021, Bitcoin (BTC/USD) made all-time highs at 69000. Since then, price has been moving lower, having recently made a low of 32950.72 on January 24th. This was roughly a 52.25% pullback from the highs.
The cryptocurrency halted its descent after testing a confluence of support at prior highs from June 2021 and the 61.8% Fibonacci retracement from the lows of December 16th, 2020 to the highs of November 10th, 2021. The levels are 36623.79 and 38368.75, respectively. BTC then bounced and is currently testing the underside of a long-term trendline dating to the December 16th, 2020 lows, near 39300.
Notice as well that the all-time high was the head of a Head and Shoulders pattern. As price moved lower, it bounced at the neckline as it tested the 200 Day Moving Average, near 45500, forming the right shoulder. BTC reached 52098 on the bounce, however fell back through the 200 Day Moving Average and the neckline of the pattern near 47525. The target for a Head and Shoulders pattern is the height from the head to the neckline added to the breakdown point of the neckline. In this case, the target is below the 2017 highs near 18335.
If one is looking for other clues as to where Bitcoin may head next, that trader can look at the S&P 500. The two assets have a strong positive correlation at +0.93. Readings above +0.80 are considered strong correlations. Therefore, if traders expect the S&P 500 to move in one direction, they can anticipate that Bitcoin will move in the same direction.
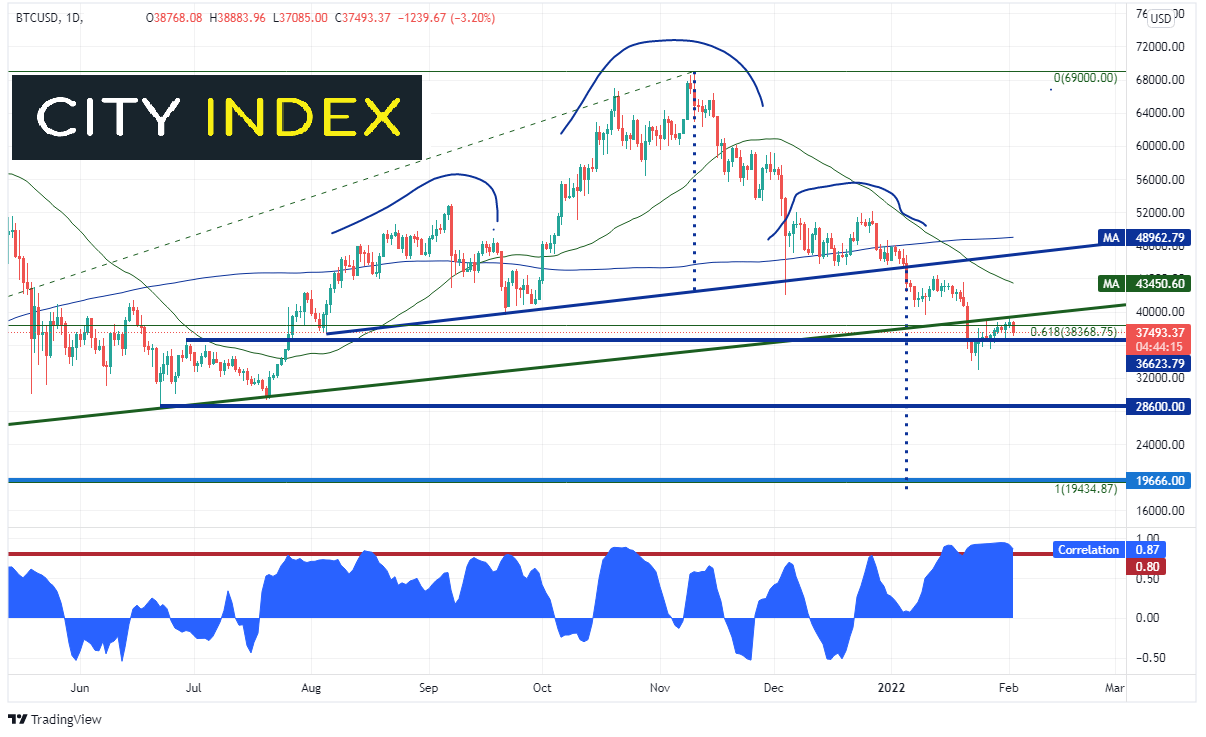
Source: Tradingview, Stone X
On a shorter, 240-minute timeframe, Bitcoin has retraced to the 61.8% Fibonacci retracement level from the high of January 20th to the lows of January 24th near 39473.5. In doing to, price formed a pennant formation. The target for the pennant is the height of the pennant “pole” added to the breakdown point from the pennant. In this case, the target is near 28600.
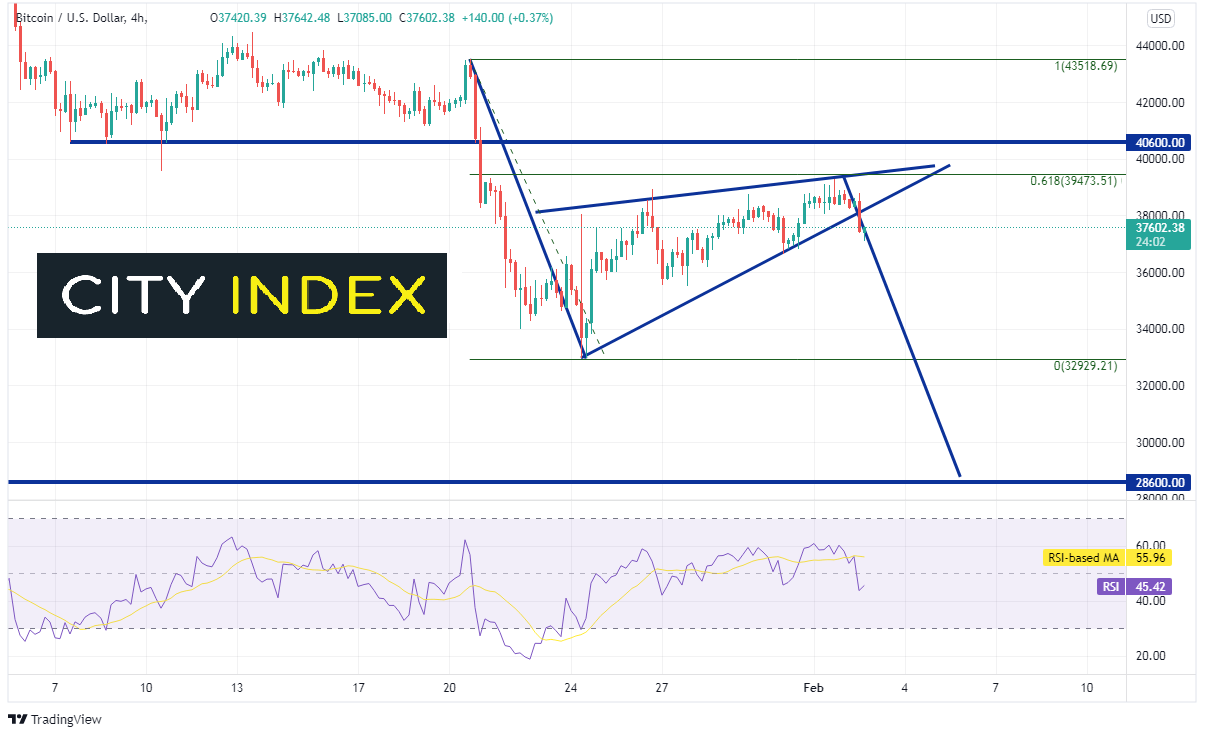
Source: Tradingview, Stone X
First support is at the January 24th lows near 32929 and then horizontal support dating back to June 22nd, 2021, near 28600. Below there, price can fall all the way to the 2017 highs at 19666. First resistance is just above at the previously mentioned 61.8% Fibonacci level of 39473.5. Above there, horizontal resistance is at 40600 and then a confluence of resistance at the January 20th highs of 43518.69 and the 50 Day Moving Average at 43450 (see daily).
The technicals on both the daily chart and the 240-minute chart point to more downside for bitcoin. However, the cryptocurrency is strongly correlated to the S&P 500. Therefore, if traders think there is room for the S&P 500 to continue moving higher, than given the strong correlation, Bitcoin may move higher with it.
Learn more about cryptoasset trading opportunities.
Latest market news
Yesterday 01:32 PM
Yesterday 09:35 AM
Yesterday 07:23 AM
Yesterday 04:48 AM
Yesterday 12:17 AM
July 25, 2024 10:39 PM
Latest Trade Ideas articles

Yesterday 09:35 AM

Yesterday 12:17 AM

July 25, 2024 10:39 PM

July 25, 2024 05:30 PM