


Bitcoin has managed to climb further higher today, along with most other risk assets. From its lowest point in June around $17.5K, BTC/USD has climbed some 35% higher. While that looks impressive, let’s remind ourselves that at around $23.8K, it still remains miles below the all-time high of $69K. It has definitely got a long way to go to get anywhere near that level again, but at least for now it looks like the selling may be done after spending several weeks in a relatively tight consolidation range as the bulls and bears battled it out around the $20K handle. The fact that we are now starting to climb back towards the mid-$20Ks suggests that better times are ahead.
Bitcoin’s recovery has coincided with the firmer stock markets and a weaker US dollar. While not a lot has changed fundamentally, there is some hope that soon we might see the end of aggressive central bank tightening because peak inflation is nigh.
Indeed, we have seen a number of key commodity prices come down sharply over the past few months, raising hopes that inflation will also head lower:
- Wheat down about 40% from peak in March
- Corn down 25% from April peak
- Cotton down about 40% from peak in May
- Aluminium down 35% from peak in March
- Copper down more than 35% from peak in March
- Crude oil down 20% from peak
If inflation does come down, as we expect that it might, then this will renew hopes that central banks will stop their aggressive tightening in the not-too-distant future, and possibly even go in reverse in order to prevent a severe recession.
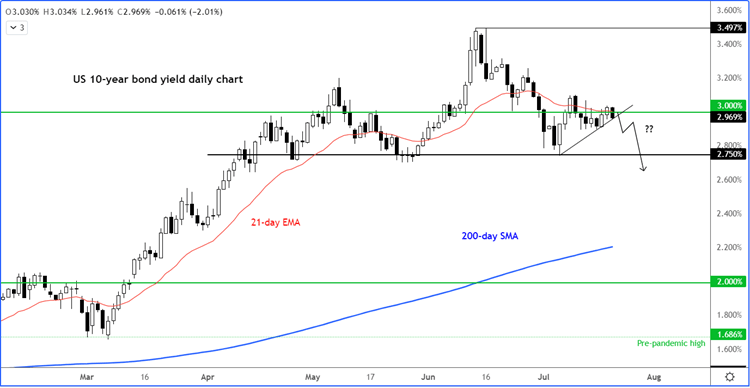
This is why it is important to keep an eye on bond yields, as that is where the so-called “smart money” is at. The US 10-year Treasury yield has struggled to hold above 3% in recent times, which is definitely a welcome sign for crypto investors.
Reflecting the slight macro optimism, we have seen some positive price action on Bitcoin recently:
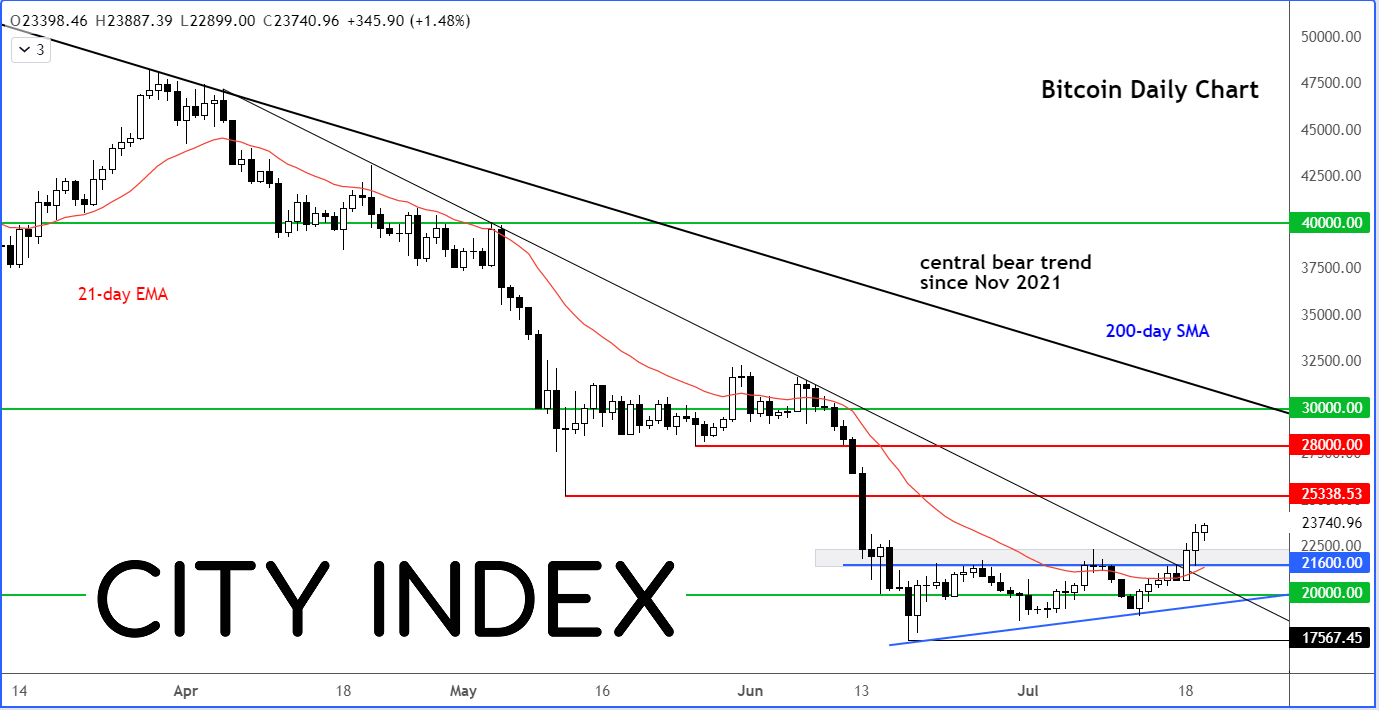
As you can see from the daily chart, BTC/USD broke out of its ascending triangle consolidation pattern to the upside earlier this week. In doing so, it also took out resistance around $21,600 and climbed above the 21-day exponential average.
This begs the question: Has Bitcoin bottomed out around $20K or is this another bear market rally?
Well, if you look at the weekly, I wouldn’t be surprised if it did bottom out here:
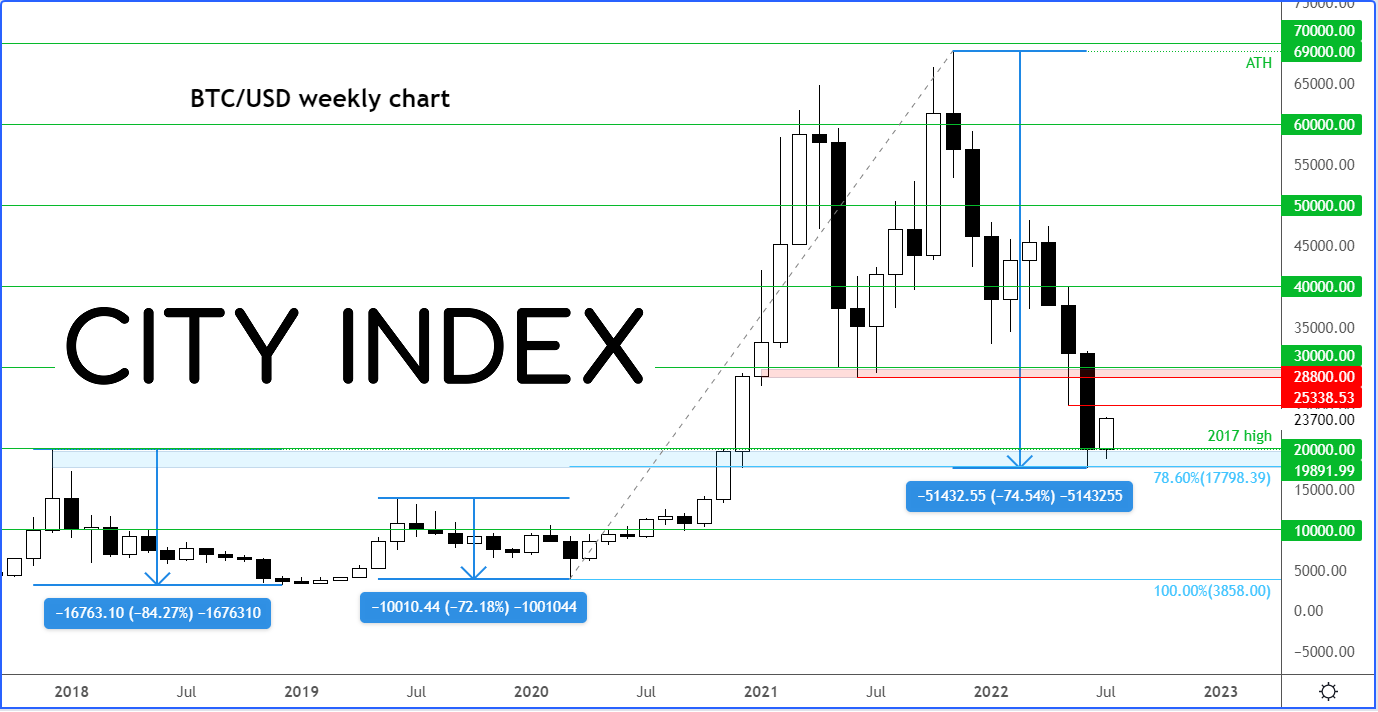
Previous major sell-offs have been between 70 to 85 per cent, similar to this one, before Bitcoin went on to rally to new highs.
I am not saying we will necessarily see a new all time high for BTC this time, but at least a nice bounce should be expected given the extent of the drop and the fact that we are testing the highs from 2017, an old major resistance area.
How to trade with City Index
You can trade with City Index by following these four easy steps:
-
Open an account, or log in if you’re already a customer
• Open an account in the UK
• Open an account in Australia
• Open an account in Singapore
- Search for the company you want to trade in our award-winning platform
- Choose your position and size, and your stop and limit levels
- Place the trade
Latest market news
Yesterday 01:32 PM
Yesterday 09:35 AM
Yesterday 07:23 AM
Yesterday 04:48 AM
Yesterday 12:17 AM
July 25, 2024 10:39 PM
Latest Trade Ideas articles

Yesterday 09:35 AM

Yesterday 12:17 AM

July 25, 2024 10:39 PM

July 25, 2024 05:30 PM