


Bitcoin is the kind of market that can make a mockery of traditional technical analysis terms such as ‘overbought’ and ‘oversold’. When it rallies, it can do so at such pace that you’d be forgiven for having a sore neck and squinted eyes trying to watch it. And at ~42% up for the month of February, Bitcoin is clearly within its latest parabolic-bull phase of the cycle. But with it fast approaching its record high, how much fuel is left in this rally’s tank?
Bitcoin technical analysis (monthly chart):
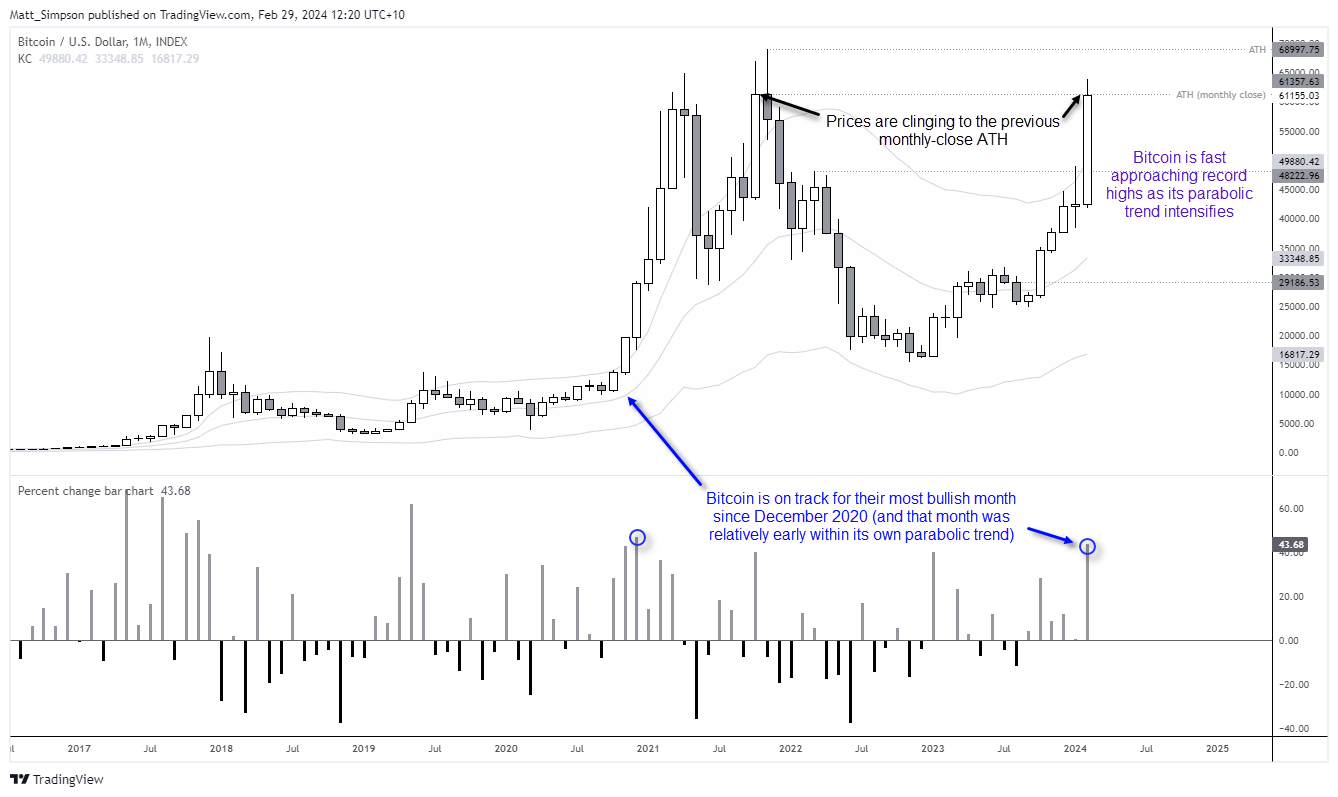
The rally from the 2022 low is picking up pace, although prices have retreated yesterday and are now clinging to the monthly0close ATH and remains outside the upper Keltner band.
But perhaps the more striking observation is that Bitcoin is on track for its most bullish month since December 2020, and that month was relatively early within its own parabolic trend. If this means Bitcoin is ‘just warming up’, the it becomes difficult to fathom just how high it could fly.

With that said it is also worth noting that the $60-$70k region prompted sharp reversals from record highs and subsequent bear trends. And as prices are now clinging to the previous monthly-close ATH, it suggests markets are watching these key levels.
Bitcoin technical analysis (weekly chart):
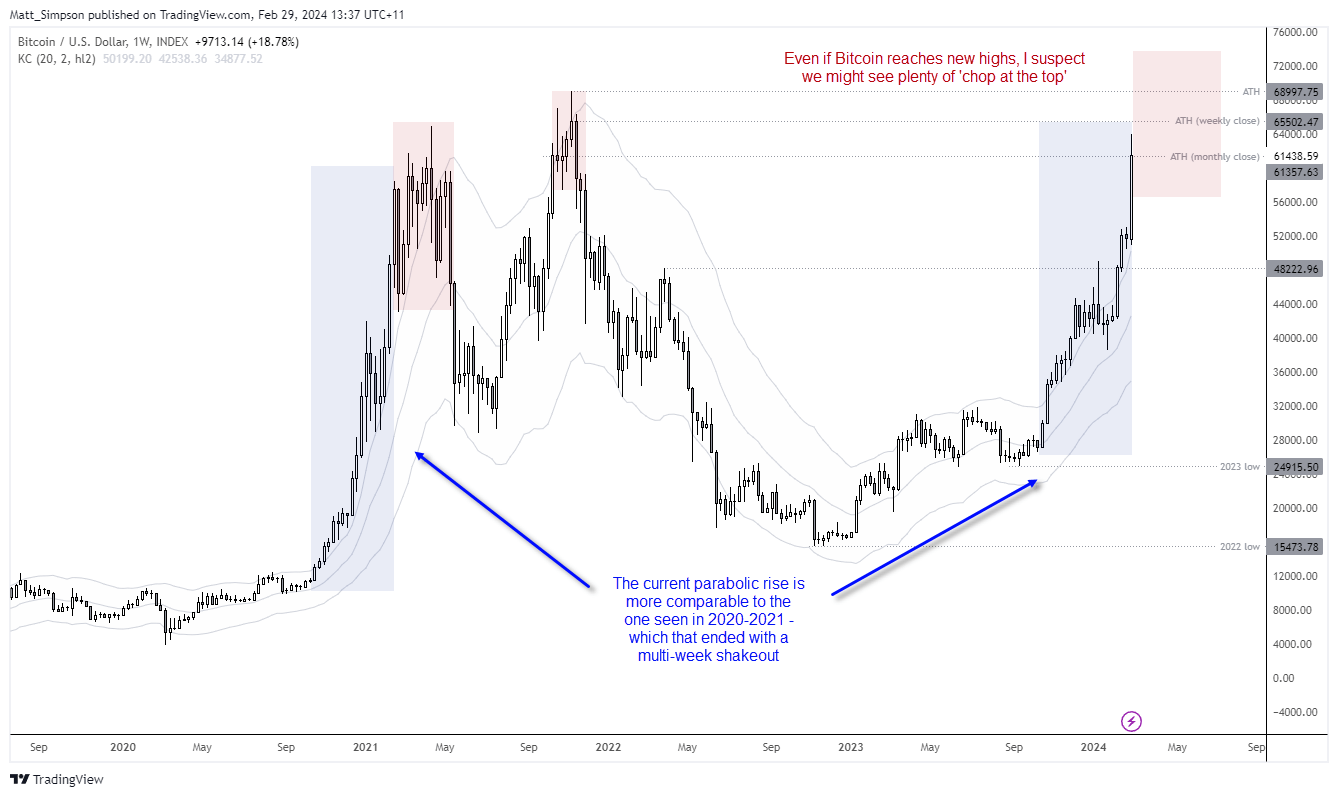
The parabolic nature of Bitcoin is best seen on the weekly chart, and the current rally is likely more comparable to the runup seen in the first half of 2021. And if this rally is to play out in a similar fashion, it suggests volatility over the coming weeks could follow before prices fall. And regardless of whether we then see Bitcoin enter a multi-month bear trend or simply break to new highs seems irrelevant for traders looking to enter today. As my bias is that one-way volatility may become a thing of the past, and that we may be about to enter a period of 2-way volatile shakeouts.
Bitcoin technical analysis (daily chart):
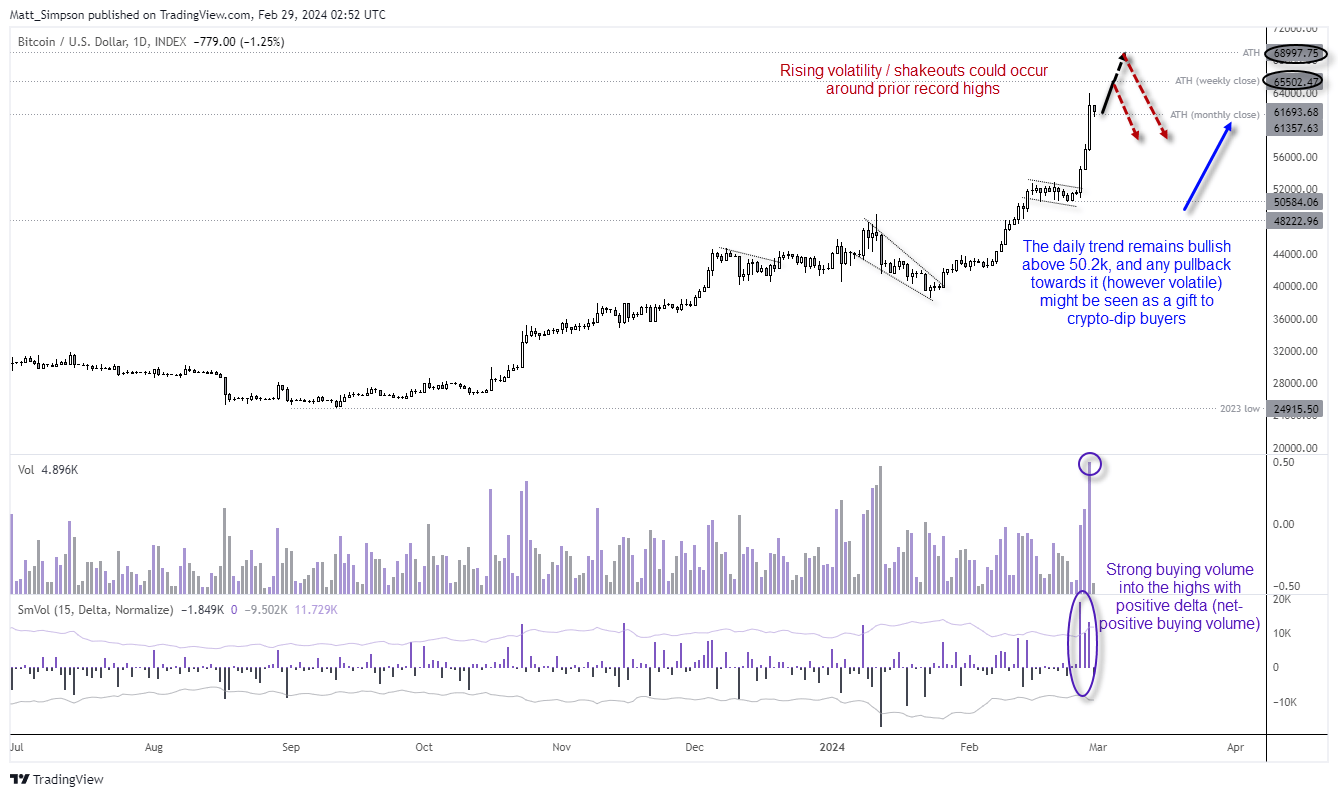
If this were any other market, it would likely be in the 'blow-off top - don't go near that bubble' category. But Bitcoin is back in its parabolic-rally phase, with no immediate signs of a top on the daily chart. Volumes are high heading into the highs with a positive delta (positive buying volume).
Given Bitcoin’s parabolic nature, it does look as though it at least wants another crack at the ATH (weekly close) or actual ATH. However, resistance levels and record highs are levels which tend to tempt ‘weaker hands’ book profits. SO I would not be surprised to see a volatile shakeout around 65.5k and 69k, given their historic significance. Yet as the daily trend remains bullish above the 50.5k low, any pullback towards it – however volatile – could be seen as a gift to bullish-crypto fans who clearly want to drive this to a record high.
-- Written by Matt Simpson
Follow Matt on Twitter @cLeverEdge
How to trade with City Index
You can trade with City Index by following these four easy steps:
-
Open an account, or log in if you’re already a customer
• Open an account in the UK
• Open an account in Australia
• Open an account in Singapore
- Search for the market you want to trade in our award-winning platform
- Choose your position and size, and your stop and limit levels
- Place the trade
Latest market news
Yesterday 01:32 PM
Yesterday 09:35 AM
Yesterday 07:23 AM
Yesterday 04:48 AM
Yesterday 12:17 AM
July 25, 2024 10:39 PM
Latest Trade Ideas articles

Yesterday 09:35 AM

Yesterday 12:17 AM

July 25, 2024 10:39 PM

July 25, 2024 05:30 PM