


The average true range is a technical indicator that tells you a market’s current volatility – making it a key part of many successful strategies. Learn how to use the ATR indicator in your trading here.
- Average true range explained
- Average true range calculation
- How to trade with the ATR
- How to use ATR as a volatility indicator
- ATR vs Bollinger Bands
- Limitations of the ATR
- ATR FAQs
The average true range explained
The average true range (ATR) is a measure of how much a market might move in any given session, calculated by averaging movement over a set timeframe. This is usually 14 periods, although you can adjust it to be longer or shorter according to your strategy.
The ATR indicator was invented by J. Welles Wilder, a noted commodities technical analyst who also created the average directional index (ADX) and the relative strength index (RSI). Like those indicators, it is non-directional, meaning that falling ATR doesn’t give a bearish signal – it just indicates a drop in volatility.
Like a moving average, the ATR updates with each new session, taking the previous period into account. However, instead of averaging price, it does so with the market’s ‘true range’.
Average true range calculation
To calculate the average true range, you first need to know your market’s true range (TR) – as well as the previous ATR figure. Then, the ATR formula looks like this:
ATR = ((Previous ATR x 13) + Current TR) / 14
What’s the true range? It is the absolute highest value returned from these three calculations:
- Current session high – previous close
- Current session low – previous close
- Current high – current low
Here, ‘absolute highest value’ means that it doesn’t matter if the figure is positive or negative. We just take the greatest number of the three.
If you don’t want to use 14 periods for your ATR calculation – Wilder used seven – then you just adjust the final figure and make sure to use that figure minus one instead of 13 in the brackets. Of course, most traders don’t do this manually. They just change the settings of the indicator in their trading platform.
ATR formula example
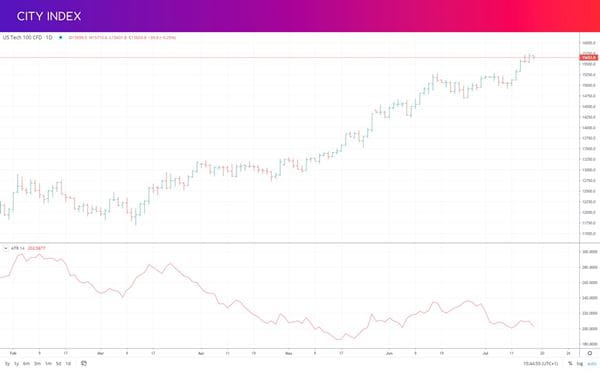
Say, for example, that the US Tech 100 has a high of 15,800, a low of 15,600 and previously closed at 15,500.
- 15,800 – 15,500 = 300
- 15,600 – 15,500 = 100
- 15,800 – 15,600 = 200
300 is the highest value of the three, so the TR is 300. Let’s say that its previous ATR is 250.
ATR = ((250 x 13) + 300) / 14 = 253.57
How to trade with the ATR
Most traders use the ATR to measure volatility, giving them a more comprehensive view of current market conditions. If the ATR indicator is increasing, it means that volatility is growing – creating more trading opportunities, as well as more risk. If it is decreasing, the market is slowing down.
Sometimes, volatility can spike, sending the ATR much higher. When a market is suddenly moving faster than it was before, it is usually worth investigating why instead of jumping straight into a trade.
Evaluating opportunities with ATR
A common use for the average true range is to evaluate new opportunities. Let’s return to our example above to see how.
Say you’re a day trader who’s noticed that the US Tech 100 is rallying in the current session, and it's already gained 200 points. Should you join the trend?
According to the ATR indicator, the index is only moving 250 points on average on any given day at the moment. So, it might not have much more movement left – making it more likely that the market will move close to the open instead of rising further.
That’s not to say that you should short the index instead. Usually, the ATR is used to evaluate the opportunities from other strategies – not to generate signals itself.
Exiting trades with ATR
There are a few different ways to use the ATR to find profit targets and stop losses.
One is to use the indicator’s reading to calculate how much a market might move over a set time. Then, based on how long we want our trade to be open, we can place a realistic profit target, and ensure our stop loss is correctly balanced.
Another is to use the ATR to calculate your trailing stop. Essentially, here you multiply the current ATR by a figure of your choosing (most often two) and use that to place your trailing stop.
The multiple you use depends on your style and strategy – and remember, ATR will automatically recalculate based on the timeframe of your chart. If you’re using a five-minute chart, your ATR will plot the predicted volatility within a five-minute session.
How to use ATR as a volatility indicator
Another popular use of ATR is as a measure of volatility across markets. Volatility is often sought after by traders since it enables you to capture profits over shorter horizons – albeit with the risk of losses quickly adding up too.
Using tools like TradingView, you can even screen markets by their volatility according to the average true range. This means you can find the markets that are moving right now and focus on them if you wish. Or alternatively, avoid areas that are especially volatile.
Some traders look to compare the current ATR against a longer-term average. That way, you can see which markets are seeing volatility spikes compared to normal.
The benefit of using ATR against other volatility indicators like the VIX is that you can measure movement on any individual market – the VIX tracks sentiment on the S&P 500 (and therefore wider stock market fear) but isn’t as useful for tracking specific stocks, indices or FX pairs.
Start trading with ATR
Follow these steps to start using the ATR indicator with City Index today:
- Open your City Index account, or log in if you already have one
- Add some funds
- Select ‘Average True Range’ on the chart of your chosen market
- Open your buy or sell position
Alternatively, you can practise trading with a cost-free City Index demo account. You’ll get full access to our platform, preloaded with virtual funds. So, you can test out your trading strategy with zero risk.
To adjust the parameters of the ADX indicator on the City Index platform, select the settings icon when you hover over or tap the indicator’s name on your chart. Here, you can change the number of sessions the ATR tool takes into account.
ATR vs Bollinger Bands
Both ATR and Bollinger Bands are used to view a market’s current and past volatility, but the two indicators work in different ways. ATR is essentially a moving average of the market’s true range, while Bollinger Bands plot lines two standard deviations from a price MA.
In addition:
- Bollinger Bands can be used to generate overbought and sold signals, whereas ATR does not
- ATR is an oscillator, appearing below a market’s chart. Bollinger bands are overlayed on current price action
Some traders use both tools, while others stick to one exclusively.
Limitations of the ATR indicator
Like many technical indicators, ATR is inherently backwards facing. It can only show you the average true range over recent sessions, not predict what it might be in the future. It is also highly subjective – there’s no ‘good’ or ‘bad’ ATR reading, the calculation is up to your own interpretation.
The ATR is best used in conjunction with other indicators, like the RSI or stochastic oscillator.
ATR FAQs
What are the best average true range settings?
The most commonly used settings for the average true range indicator are to calculate an average of the market’s true range over the past 14 sessions. However, you can adjust this figure according to your strategy.
Reducing the number of sessions will make the ATR more sensitive to recent volatility. Increasing it, meanwhile, will create a smoother, longer-term reading.
How do you read the ATR indicator?
You read the ATR indicator by checking the line at the bottom of your chart when the ATR is installed. If it is going up, then the market is seeing increased volatility. If it is going down, then price action on your market is tightening.
Latest market news
Yesterday 01:32 PM
Yesterday 09:35 AM
Yesterday 07:23 AM
Yesterday 04:48 AM
Yesterday 12:17 AM
July 25, 2024 10:39 PM
Latest Financial market insight articles

June 17, 2024 01:00 AM


March 26, 2024 04:11 AM

November 13, 2023 11:05 AM