


Bollinger bands are one of the most commonly used technical analysis indicators. Find out how they work and how to trade using Bollinger band strategies.
What are Bollinger bands?
Bollinger bands are a momentum indicator that comprises of a simple moving average sandwiched between two lines plotting a positive and negative standard deviation – which measures how close prices are to the average.
Bollinger bands were developed by John Bollinger to help define the potential high and low prices of a market relative to its moving average, giving traders a way to visualise volatility and determine when a trend may continue or reverse. The bands widen during volatile periods and contract during non-volatile periods.
Bollinger bands can be used on multiple timeframes, ranging from minutes, hours, days and weeks. The common timeframes are daily for short-term traders and weekly for longer-term traders.
How do Bollinger bands work?
Bollinger bands work by plotting two standard deviations away from a central simple moving average (SMA).
You don’t necessarily need to understand the Bollinger band formula, as it’s calculated for you in most trading platforms. But you do need to understand what the three bands on the chart are showing you.
- The middle band is the average price of an instrument over a specific period
- The upper band is the middle band plus two standard deviations
- The lower band is the middle band minus two standard deviations
During normal market conditions, the bands usually appear to move together, creating a synchronous pattern. But during periods of high or low volatility, this changes.
If the distance between the bands is tight, it indicates low volatility in the market. If the distance between the bands is wide, it shows high volatility in the market.
When price movements closely follow the middle band, traders consider the instrument to be trading within its average range.
How to use Bollinger bands
As Bollinger bands are continually changing based on real-time price movements, traders use the bands in several different ways – primarily to generate overbought or oversold signals and to clarify price patterns.
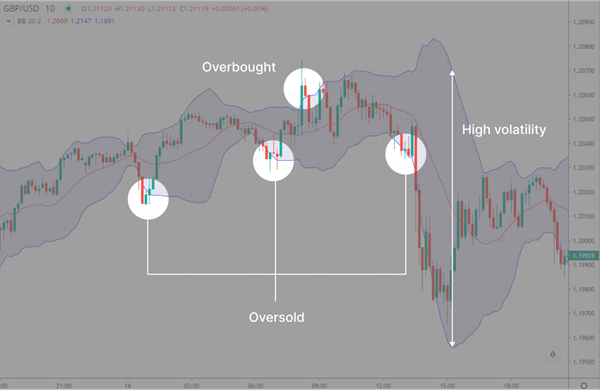
Overbought signals
When price action is close to the upper band, the current price of the instrument is considered high relative to recent prices. If they cross the upper band, traders consider the instrument to be overbought.
Oversold signals
When price moves close to the lower band, the current price is considered low relative to recent prices. If they cross the lower band, traders consider the instrument to be oversold.
Price patterns
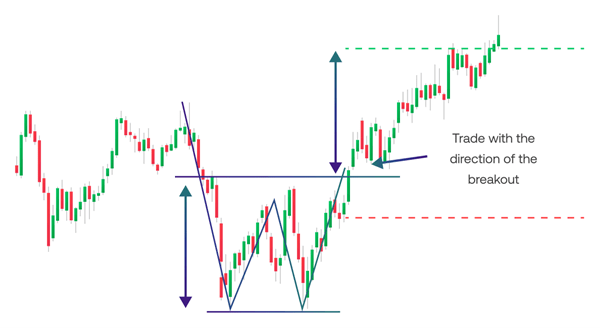
Bollinger bands can be used to provide more insight into price patterns that appear in data. They’re mainly used in clarifying ‘M’ tops (or double tops) and ‘W’ bottoms (or double bottoms).
In an M pattern, if the market price hits two highs consecutively with a decline in the middle, it’s seen as a bearish reversal pattern – meaning the market price is likely to fall. Bollinger bands can help confirm this resistance level if the price bounces off the top line back toward the middle.
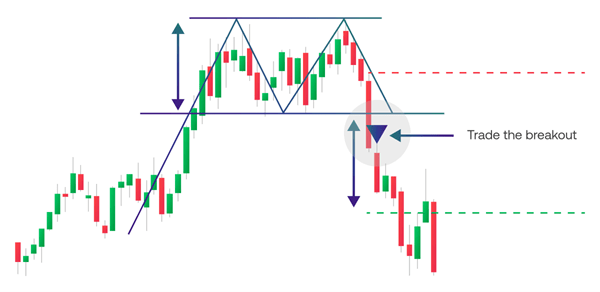
Conversely, in a W pattern, the market price hits two lows consecutively with a rise in the middle. This is a bullish reversal pattern, indicating the price is likely to break out higher. Bollinger bands can be used to confirm the resistance level in this case if the price bounces off the bottom line back toward the centre.
See our candlestick pattern cheat sheet
Bollinger band strategies
Bollinger bands are not suitable for a standalone strategy, they need to be combined with other indicators to make any informed decisions about price volatility.
Learn more about trading strategies
John Bollinger himself suggests using them with two or even three non-correlated indicators to confirm any signals that they give out. In the rules for using Bollinger bands, he describes the appropriate indicators as momentum, volume, sentiment, open interest and other inter-market data.
So, naturally, some of the best Bollinger band strategies combine the tool with other popular indicators, such as:
- Moving averages
- MACD
- RSI
1. Bollinger band and moving average strategy
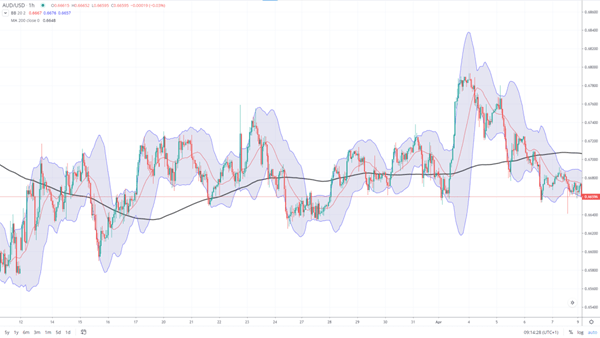
Although Bollinger bands already use a moving average, you can apply a longer-term simple moving average – such as a 100 or 200-day – as an overlay to get more insight into the basic price action.
When a market’s price is higher than its moving average, it’s said to be in an uptrend. This means we can look for buy signals. And when the price moves below the moving average, we can look for sell signals.
Looking at the Bollinger bands too, we get further signals depending on how close the bands are to the SMA. For example, when the price crosses the SMA and no part of the Bollinger bands touches the SMA, it’s likely the market will soon correct itself back toward the SMA.
The black line on this chart is a 200-day SMA. As we can see, the Bollinger bands frequently rise and fall back toward this line. Even on longer divergences, the two will eventually meet again.
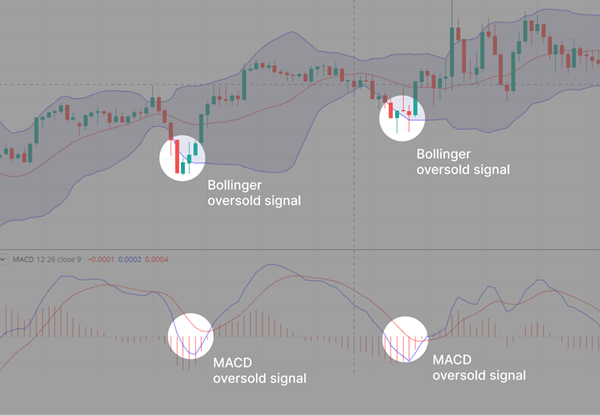
2. Bollinger bands and MACD trading strategy
Another popular strategy is to combine Bollinger bands with the Moving Average Convergence Divergence (MACD) indicator.
Here, traders are looking to identify points where the moving averages of the MACD cross with the histogram displayed below the price chart. And if these signals align with those of the Bollinger bands, it can be taken as confirmation of the position. As we can see on the following chart.
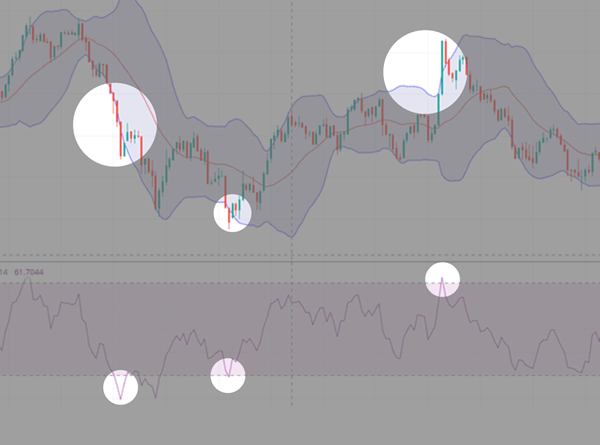
3. Bollinger bands and RSI strategy
The relative strength index (RSI) is a momentum indicator, it displays the speed and strength of price change – which is something Bollinger bands can’t tell us.
The RSI oscillates between 0 and 100. A value above 70 is a signal the market is overbought, and a value below 30 is a signal it’s oversold.
If a market is trading above its Bollinger band, you’d be looking for an overbought signal on the RSI. And if the market is below the bands, you’d be looking to confirm it with an oversold signal on the RSI.
Traders can also look for RSI divergences. When the market reaches higher highs, but the RSI indicator shows a lower high – a bearish divergence – it indicates that the momentum is weak so the market will likely reverse downward.
Conversely, when the market makes lower lows, but the RSI is making a higher low – a bullish divergence – this is a sign of strength and indicates the market could bounce upward.
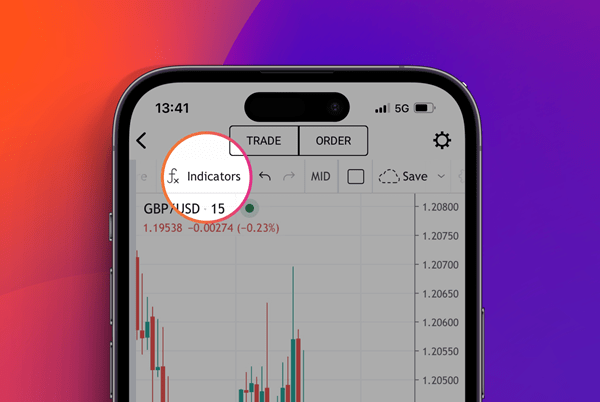
How to set up Bollinger bands on City Index’s platforms
To set up a moving average on our trading platform, all you need to do is open the price chart for your chosen market and select the indicator list at the top of your chart.
Then just search for ‘Bollinger bands’ and you’ll be able to choose from the regular bands, Bollinger bands %B – which also plots the stock's closing price as a percentage of the upper and lower bands – and Bollinger band Width, which shows the difference between the upper and the lower Bollinger bands.
Finally, click Bollinger bands and it will appear on your chart.
The process is the same whether you’re looking to use our Web Trader platform or mobile app – if you’re using the app, you just need to hit the ‘full screen’ option in the bottom left corner to see your full chart menu.
Try using Bollinger bands risk free
You don’t need to risk capital when you’re building your confidence using Bollinger bands. You can sign up for a City Index demo, and see how they work on real prices but with virtual funds.
Then, when you’re ready, you can start trading on live markets by following these steps:
- Sign up for a City Index account – it usually takes less than five minutes
- Add some funds, so you can start trading instantly
- Log in to our platform and choose your markets
- Load up our advanced charts with your preferred technical tools
- Start trading
Bollinger bands summed up
- Bollinger bands are a momentum indicator
- They’re made of three lines, which are a simple moving average sandwiched between a positive and negative standard deviation
- If the distance between the bands is tight, it indicates low volatility in the market
- If the distance between the bands is wide, it shows high volatility in the market
- Bollinger bands are mainly used to generate overbought or oversold signals and to clarify price patterns
- Bollinger bands are not suitable for a standalone strategy, they need to be combined with other indicators
- Common strategies for using Bollinger bands also use moving averages, the MACD indicator and RSI
- To set up Bollinger bands on a trading platform, you just need to select it from the indicator list at the top of your price chart
Start using moving averages with City Index by opening an account or creating a risk-free demo.
Bollinger bands FAQ
Are Bollinger bands reliable?
Bollinger bands are reliable for most asset classes – whether that’s equities, indices, forex, commodities or bonds – but it’s important to understand that they do not provide continuous advice but assist in identifying trading opportunities. Bollinger bands should always be used in conjunction with other indicators and a risk management strategy.
How do you interpret Bollinger bands?
You interpret Bollinger bands by looking at how close the price is to the indicator. If the price moves toward the upper band, it’s a sign the market is overbought. If the price moves toward the lower band, it indicates the market is oversold. These signals can be a key component in a trading strategy, finding entry and exit points.
What time frame is best for Bollinger bands?
Bollinger bands can be used in pretty much any timeframe whether that’s 5 minutes, one hour, daily or weekly. The key is just ensuring that the timeframe includes enough data and information to give you a clear overview of the market price.
Learn more about trading charts
What type of indicator are Bollinger bands?
Bollinger bands are a momentum indicator that can be used to determine whether a price is moving higher or lower. It helps traders visualise volatility and determine when a trend is likely to continue or reverse.
Learn more about technical indicators
Latest market news
Yesterday 01:23 PM
Yesterday 06:01 AM
April 18, 2024 11:27 PM
April 18, 2024 04:46 PM
Latest Technical Analysis articles
April 15, 2024 07:13 PM
April 14, 2024 11:37 PM
April 13, 2024 08:00 PM
April 12, 2024 04:51 AM