


Monday US Close:
- The Dow Jones Industrial fell -162.79 points (-0.45%) to close at 36,068.87
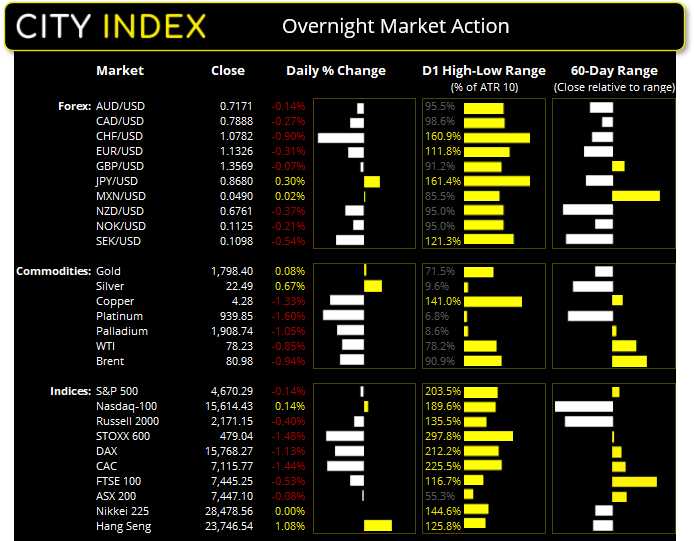
- The S&P 500 index fell -6.74 points (-0.15%) to close at 4,670.29
- The Nasdaq 100 index rose 22.239 points (0.14%) to close at 15,614.43
Asian Futures:
- Australia's ASX 200 futures are down -46 points (-0.62%), the cash market is currently estimated to open at 7,401.10
- Japan's Nikkei 225 futures are down -40 points (-0.14%), the cash market is currently estimated to open at 28,438.56
- Hong Kong's Hang Seng futures are down -105 points (-0.44%), the cash market is currently estimated to open at 23,641.54
- China's A50 Index futures are down -16 points (-0.1%), the cash market is currently estimated to open at 15,430.20
After Wall Street opened the pause in Asia yesterday was nothing more than that as investors were quick to offload risky assets. Bond yields continued to rise in anticipation of the Fed raising rates potentially four times this year and expectations for a March hike rose to nearly 80%, sending the US 2-year yield rose to a near-2-year high of 0.90%, the 10-year rose to 1.8% for the first time in 2-years. News that the US lodged a record number of hospitalisations on Monday over 132k also dented sentiment. The Nasdaq hit a session low of -2.4%, the S&P 500 fell -2% and the Dow was -1.4% lower.
However, the late recovery for the major benchmarks, which left a trail of bullish hammers on the daily chart, leaves open the possibility that this could be a flush out during lower liquidity trade. Key levels of support remain intact (even if challenged, in the case of the Nasdaq) so do not write off the potential for a turn-around Tuesday just yet.
Seeking range expansion on the ASX 200 today
Volatility subsided on the AX 200 yesterday, and that can be a prelude to more volatility. The index saw a particularly bearish day on Thursday, recouped half the losses on Friday and then printed a relatively timid inside day yesterday. Given the late rebound on Wall Street we are leaning towards an up day today, but traders need to break above 7500 for any chance of a meaningfully bullish close.
AUD pairs in focus for Australian retail sales at 11:30 AEDT
As for currencies, the US dollar index (and by extension EUR/USD) remain range-bound on the daily chart. USD/JPY fell for a fourth consecutive day against its dominant trend, yet remains above 115. USD/CAD held above 1.2608 support mentioned in yesterday’s report, yet remains a level to monitor for a potential break down. GBP/USD is holding below its 200-day eMA and trend resistance on the daily chart.
Stronger than expected building approvals in Australia sent AUD broadly higher yesterday, which helped AUD/NZD recoup all of Friday’s losses against our bias. Whilst it remains possible the market has still topped around 1.0650, we’d prefer to step aside until the picture becomes clearer once more.
Read our guide on the ASX 200 trading guide
EUR/AUD headed for 1.5900?
EUR/AUD is trying to carve out a bullish trend on the four-hour chart, having printed a higher high and higher low on that timeframe. It’s back above the 100-day eMA, which has proven to be a pivotal level of late, so if price continue to hold above its recent 1.5730 low we favour a run to 1.5900, just beneath a series of swing highs and the weekly R1 pivot.
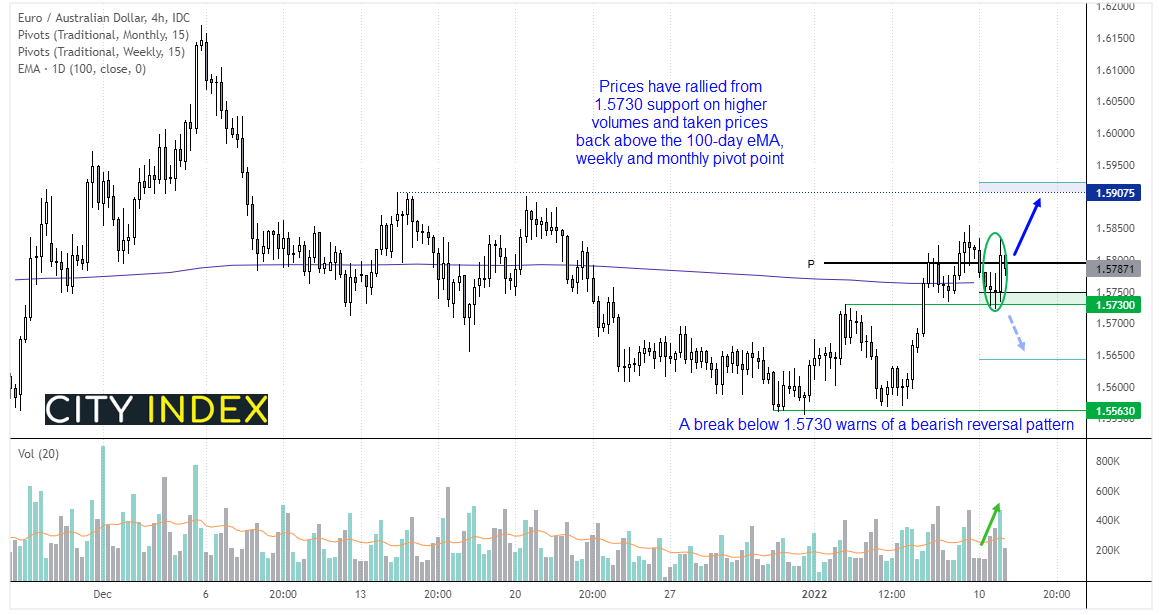
A 3-bar bullish reversal formed (Morning Star Reversal) with rising volumes to reaffirm our view that a swing low has been seen. Take note that Australia releases retail sales at 11:30 AEDT and a miss would be helpful for our bias. Should momentum reverse lower and break beneath 1.5730 our bias is invalidated.
Gold caught a bid amid risk-off trade
Gold was allowed to shine to the extent it printed a bullish engulfing candle on the daily chart. IN fact, it is actually a bullish opening Marabuzo candle as it opened at the low of the day and had a very small upper wick. From here the 1800 – 1804 zone is key as the weekly and monthly pivot reside in this zone, and if we do get the ‘turnaround Tuesday’ then gold may be unloved once more.
Oil prices retraced for a second day but not at an alarming rate. Yet it was enough to stop us out on our intraday long idea yesterday and break its bullish channel on the four-hour chart. Whilst we remain bullish overall we have a neutral view for today as we are not yet convinced its is complete.
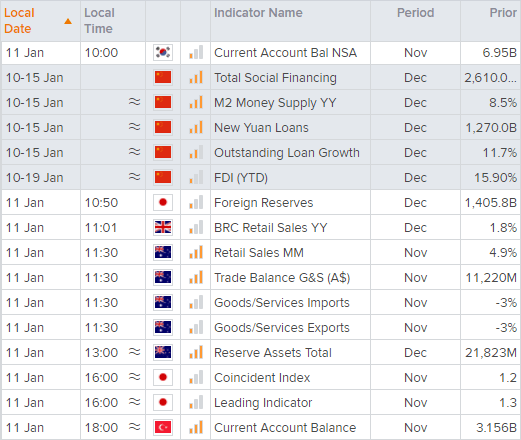
Up Next (Times in AEDT)
How to trade with City Index
You can easily trade with City Index by using these four easy steps:
-
Open an account, or log in if you’re already a customer
• Open an account in the UK
• Open an account in Australia
• Open an account in Singapore
- Search for the company you want to trade in our award-winning platform
- Choose your position and size, and your stop and limit levels
- Place the trade
Latest market news
Yesterday 01:32 PM
Yesterday 09:35 AM
Yesterday 07:23 AM
Yesterday 04:48 AM
Yesterday 12:17 AM
July 25, 2024 10:39 PM
Latest Trade Ideas articles

Yesterday 09:35 AM

Yesterday 12:17 AM

July 25, 2024 10:39 PM

July 25, 2024 05:30 PM