


January 6, 2023 3:53 AM

The US ADP Employment Change for December showed that 235,000 private jobs were added to the economy vs an expectation of +150,000. November’s print was revised higher from +127,000 to +182,000. Keep in mind however that ADP has recently changed its methodology for calculating its Employment Change. In addition, ADP has also said that this is not to be used as a leading indicator for Non-Farm Payrolls, which are to be released on Friday. Expectations for the NFP print are +200,000 vs +263,000 in November. Traders don’t seem to care about what the ADP says. Stocks sold off on the print and the US Dollar went bid as traders worry that stronger jobs may allow the Fed to be more aggressive in its rate hikes. It should also be noted that Initial Jobless Claims for the week ending December 31st, was only 204,000 vs and expectation of 225,000 and a previous reading of 223,000. This indicates that less people applied for unemployment benefits during the last week of the year than was anticipated. It was also the lowest reading since late September 2022.
USD/JPY rose aggressively during the first three quarters of 2022, trading from a low on January 14th, 2022, at 113.48 to a high on October 21st at 151.95. Since then, the pair has pulled back aggressively in an orderly downward sloping channel, closing the year below the 50% retracement from last year’s low to high at 130.77. However, USD/JPY has moved higher this week after holding horizontal support from the lows of August 2nd, 2022, at 130.39. The pair has traded higher for the past 3 days (including Thursday) and is threatening to break out above the top of the channel trendline near 133.62.
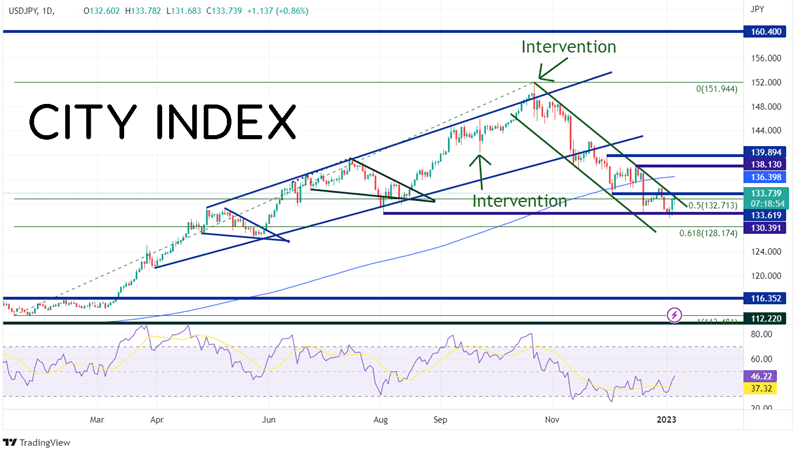
Source: Tradingview, Stone X
Trade USD/JPY now: Login or Open a new account!
• Open an account in the UK
• Open an account in Australia
• Open an account in Singapore
On a 240-minute chart, USD/JPY is nearing pervious support and the highs from December 28th at 134.50. This acts as the first level of resistance. Above there, the pair can move to the 200 Day Moving Average at 136.40 (see daily), then the highs of December 15th at 138.13. However, if this move above the long-term channel proves to be a false breakout, USD/JPY may pullback. First support is at the top trendline of the channel near 132.70. Below there, price can fall to the lows from January 2nd at 129.67 and then the 61.8% Fibonacci retracement level from the 2022 lows to the 2022 highs at 128.17.
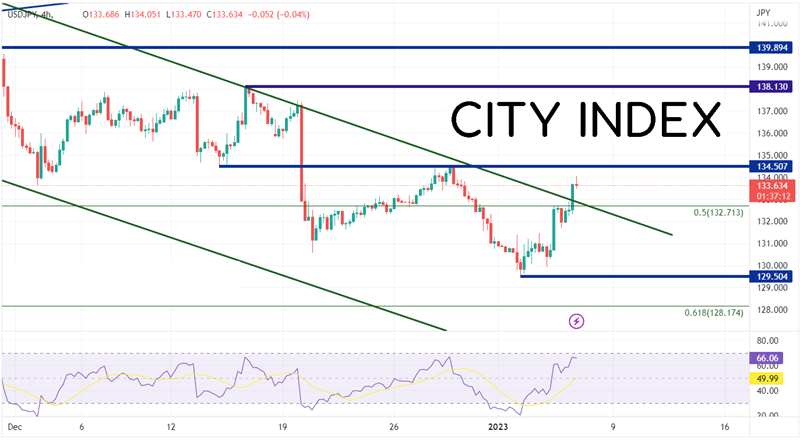
Source: Tradingview, Stone X
Good news from the jobs front has sent the US Dollar higher in anticipation of a more hawkish Fed. USD/JPY has followed right along with it. Will the pair continue to move higher? It may depend on the Non-Farm Payroll data due out on Friday!
Learn more about forex trading opportunities.
Latest market news
Yesterday 01:32 PM
Yesterday 09:35 AM
Yesterday 07:23 AM
Yesterday 04:48 AM
Yesterday 12:17 AM
July 25, 2024 10:39 PM
Latest Trade Ideas articles

Yesterday 09:35 AM

Yesterday 12:17 AM

July 25, 2024 10:39 PM

July 25, 2024 05:30 PM