
Weekly COT Report Guide
CFTC (US Commodity Futures Trading Commission) provide a weekly report on market positioning among groups of traders called the Commitments of Traders (COT) Report. As the original report is in numerical format, we take this data and represent it visually help traders assess market sentiment, trend strength or highlight potential sentiment extremes.
- Whilst the original report covers a broad range of futures markets, our weekly COT report tends to focus on major currencies* and select commodities. However, if we note something of interest elsewhere, the report can venture over to other metals, indices, interest rates or the VIX.
- The trading group we mostly focus on are ‘large speculators’ and, on occasion, managed funds. We can look at large speculators as trend followers and, using by the assumption that large speculators tend to be on the right side of the market as they are professional traders, assess which way ‘smart money’ is positioned on a given market. Taking that a step further, if too many traders are on the same side of the market, it raises the potential for a entiment extreme if positioning is stretched or at a historical extreme(a reversal of prices).
- As the data is released weekly, it is not of great use to intraday traders. However, it can help us assess the underlying strength or weakness of a trend on the weekly charts.
* As the COT report focuses futures markets, currencies are traded against the USD. This means the currency on the matrix is the numerator, and the USD is the denominator (e.g. CAD = CAD/USD, JPY = JPY/USD, GBP = GBP/USD)
COT Dashboard Overview:
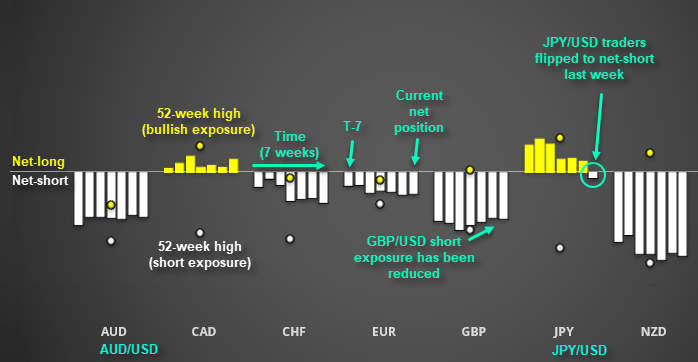
The COT dashboards provides several pieces of useful information at a glance:
- Net exposure of large- speculators* (whether they are net-long or net-short)
- The recent trend/direction of net- exposure (is the trend stronger, weaker or flat?)
- Where net-long or net-short exposure sits relative to its 52-week high**
- If a market has ‘flipped’ from net-long to net-short (or visa-versa)
* Please note that net-short exposure has been inverted to produce a negative number. This allows us easily gauge whether traders are net-long or net-short and compare to what degree they are bullish or bearish between markets.
** Net exposure for each market has been adjusted for open interest (volume). This essentially rescales the markets for easier comparison, even if some markets have very high trading volumes (e.g. EUR/USD) or very low volumes (e.g. NZD/USD).
COT Charts: Individual Markets
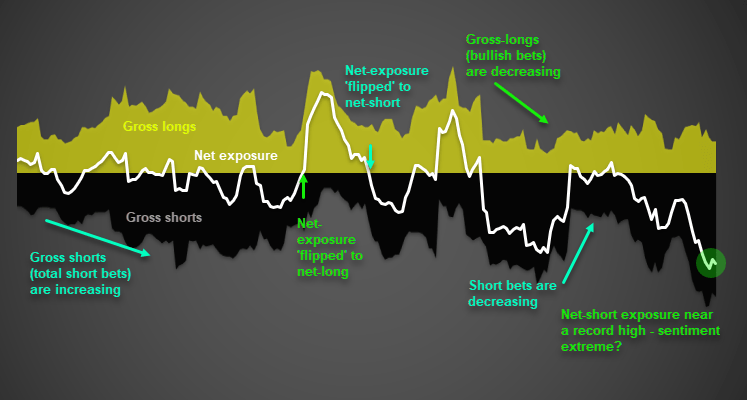
Like a trading chart, time goes from left to right with the most recent data sitting at the far right end of the chart. Usually the chart will also include the weekly closing prices of the underlying market (so a CAD COT chart would also include CAD/USD as an overlay). But for the sake of simplicity, the above example focuses on market positioning.
- White line: Net exposure (net-long/bullish above zero, net-short/bearish below zero)
- Yellow: Gross long contracts (total number of long contracts)
- Black: Gross short contracts (total number of short contracts)
Readers are free to make your own interpretations of that data. However, our weekly COT report also includes the analyst’s interpretation of the data below each chart. Furthermore, we’ll occasionally include variations of the COT chart such as Z-score or long/short ratio if we feel it underscores the analysis, which will be explained in the report where relevant.
Latest market news
Yesterday 01:32 PM
Yesterday 09:35 AM
Yesterday 07:23 AM
Yesterday 04:48 AM
Yesterday 12:17 AM
July 25, 2024 10:39 PM
Latest COT/USD articles

May 9, 2022 01:23 AM
April 4, 2022 04:05 AM
March 21, 2022 12:16 AM
March 14, 2022 01:46 AM