October 11, 2022 3:27 PM

Last week, Canada released its Employment data for September. After 3 months of negative prints, the Employment Change finally showed an increase of 21,100 jobs. Not only that, but 5,700 of the jobs were full-time jobs! This was also the first time in 3 months that the print was positive. By the way, the Unemployment Rate decreased from 5.4% to 5.2%. Strong jobs data all around. Like the Fed in the US, this should give the BOC confidence when hiking rates. Also last week , BOC Governor Macklem said in a speech that “We have not seen clear evidence that underlying inflation has come down. When combined with still-elevated near-term inflation expectations, the clear implication is that further interest rate increases are warranted.” The Bank of Canada meets again on October 26th and markets are pricing in a 50bps rate hike.
Everything you need to know about the Bank of Canada
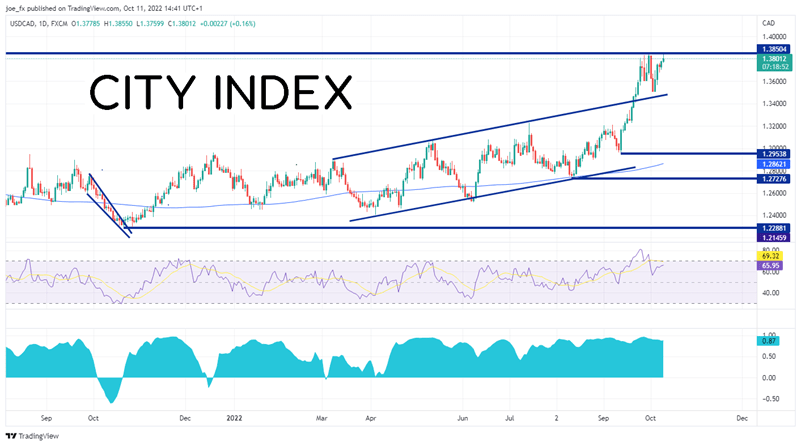
With good jobs data and hawkish comments from the Bank of Canada Governor, one may expect that the Canadian Dollar would be strong vs the US Dollar. However, the US is in the same boat as Canada regarding inflation, and traders have continued to see the US Dollar outperform its Canadian counterpart. USD/CAD has been rising in an upward sloping channel since early April when the pair reached a near-term low of 1.2498. On September 21st, USD/CAD broke above the channel near 1.3400 and has been consolidating just under resistance from April 2020. On Tuesday, USD/CAD traded at its highest level since then at 1.3855! Notice that the RSI pulled back from recent highs, which allowed the RSI to unwind back into neutral territory. This may give bulls optimism that the pair can push through resistance.
Trade USD/CAD now: Login or Open a new account!
• Open an account in the UK
• Open an account in Australia
• Open an account in Singapore
Also notice that in the bottom panel is the correlation coefficient between USD/CAD and the DXY. Correlation coefficients above +0.80 are considered strong, and the 2 assets are likely to move together. Therefore, if the DXY moves higher, USD/CAD is likely to move higher with in on the daily timeframe.
Source: Tradingview, Stone X
Trade the DXY now: Login or Open a new account!
• Open an account in the UK
• Open an account in Australia
• Open an account in Singapore
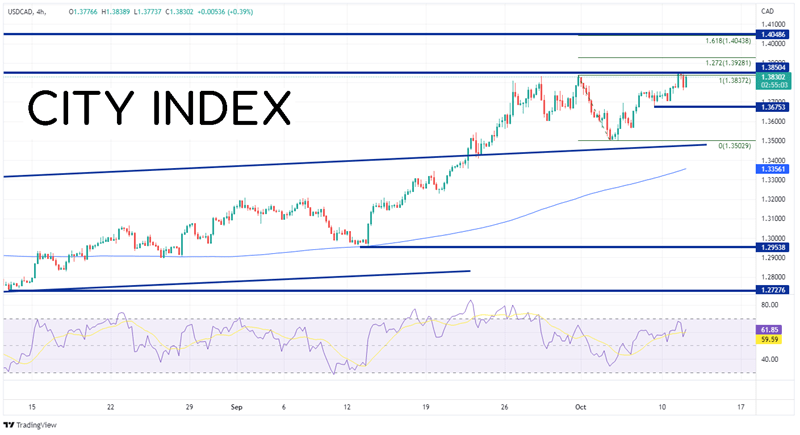
On a 240-minute timeframe, USD/CAD briefly pierced the 1.3850 level before pulling back. The next resistance above today’s high is the 127.2% Fibonacci extension from the highs of September 30th to the lows of October 4th at 1.3928. Above there is a confluence of resistance at the 161.8% Fibonacci extension from the same timeframe and the highs of May 2020 at 1.4038/1.4048. However, if the resistance holds and the pair moves lower, first support is at the lows of October 7th at 1.3669, then the lows of October 5th at 1.3503. The top line of the long-term channel comes in near that same level at 1.3590. Below there, USD/CAD can fall to the 200 Day-Moving Average at 1.3356.
Source: Tradingview, Stone X
Will USD/CAD take out the immediate resistance and continue higher? Not only will it depend on how hawkish the BOC remains, but it also may depend on what the DXY does!
Learn more about forex trading opportunities.
Latest market news
Yesterday 01:32 PM
Yesterday 09:35 AM
Yesterday 07:23 AM
Yesterday 04:48 AM
Yesterday 12:17 AM
July 25, 2024 10:39 PM
Latest Trade Ideas articles

Yesterday 09:35 AM

Yesterday 12:17 AM

July 25, 2024 10:39 PM

July 25, 2024 05:30 PM