

USD/CAD, Crude Oil Key Points
- The IEA revised its 2024 oil demand growth forecast up to 1.24M bpd amidst ongoing tensions in the Middle East.
- WTI Crude Oil is peeking out above its multi-month bearish channel, but traders may be hesitant to project continued strength after Friday’s big reversal.
- USD/CAD is pausing just below resistance at 1.3540, but near-term momentum remains with the bulls.
Crude Oil Fundamental Analysis
The crude oil market continues to grapple with heightened geopolitical tensions in the strategic Red Sea corridor, where escalating conflicts have disrupted global shipping routes, but you wouldn’t know it from it looking at the price action so far this year.
Against this backdrop, the International Energy Agency (IEA) has revised its oil demand forecast upwards, projecting an increase of 1.24M barrels per day (bpd) in 2024, up 180K bpd from the previous forecast. This revision comes amidst a backdrop of ongoing Middle Eastern tensions, notably the U.S. strikes against Houthi targets in Yemen in retaliation for attacks on shipping, and the Iran-aligned Houthis' strikes in solidarity with Palestinians.
Moreover, the IEA's outlook suggests a "comfortable and balanced" oil market for the year, despite the brewing Middle East tensions and the challenges posed by extreme cold weather in the U.S., which has led to operational disruptions in North Dakota's oil output. This forecast aligns with the Organization of the Petroleum Producing Countries' (OPEC) stable demand growth expectations, though the cartel forecasts a dramatically stronger growth in demand of 2.25M bpd this year

Crude Oil Technical Analysis – WTI Daily Chart
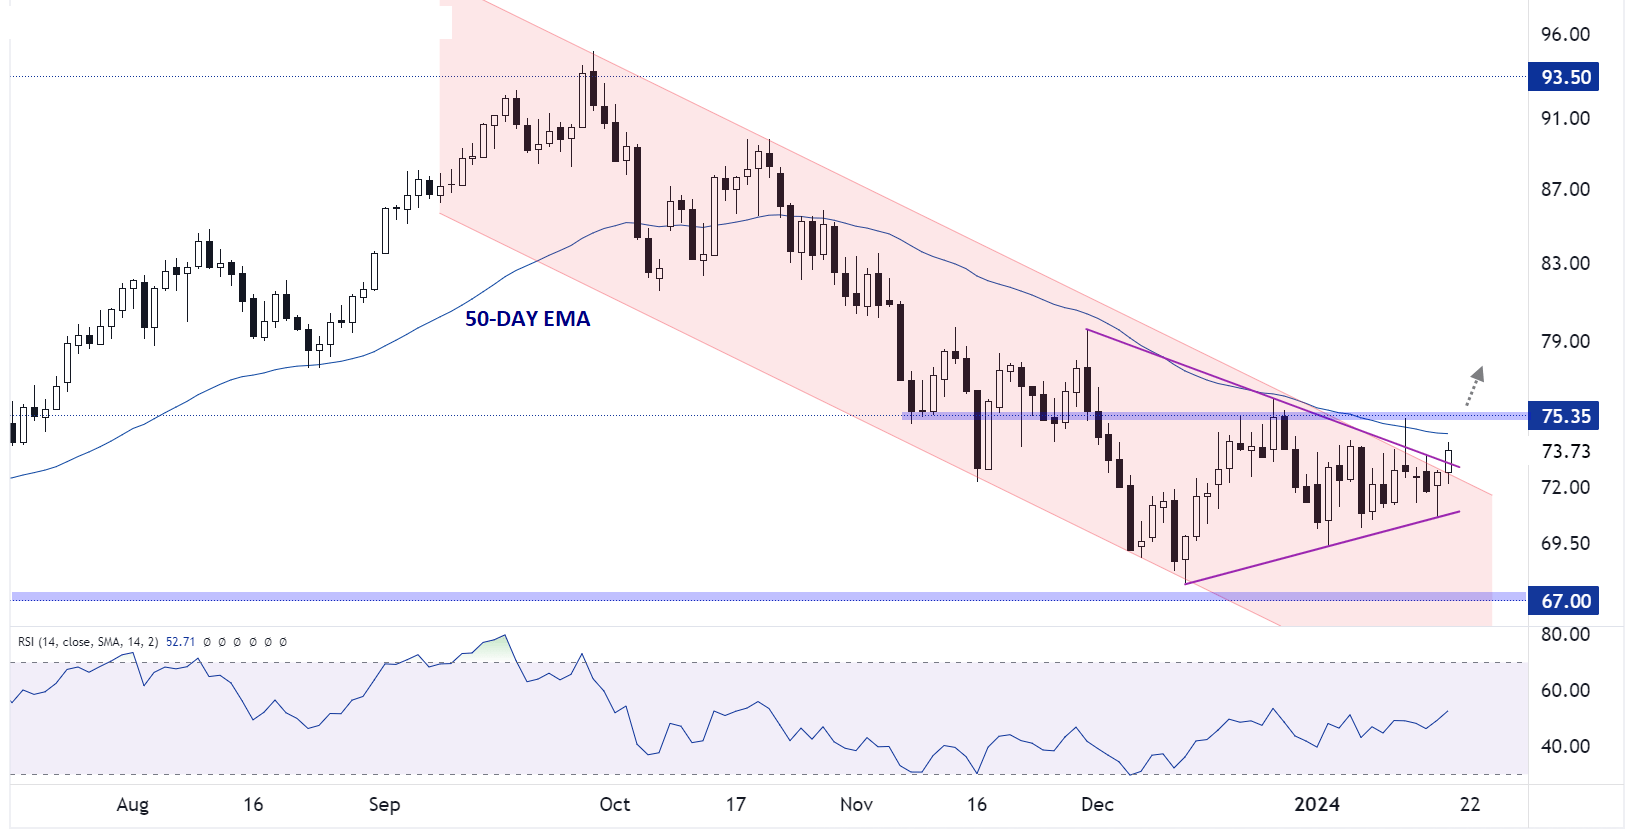
Source: TradingView, StoneX
West Texas Intermediate (WTI) Crude Oil prices are looking cautiously bullish amidst today’s rally, but traders may be “once bitten, twice shy” when it comes to bullish breakouts after Friday’s failed rally out of its symmetrical triangle pattern and bearish channel. That day, oil prices rallied from $73 to above $75…before ultimately reversing and finishing lower on the day.
After such a violent reversal to end last week, this week’s resilience is particularly impressive. Moving forward, bulls will want to see if oil can close above the bearish channel first, then likely watch for a move above the 50-day EMA and last Friday’s high in the lower-$75s before feeling comfortable that a long-term reversal may finally be at hand. Meanwhile, a drop back below $70 could signal a continuation of the multi-month downtrend, with room down toward the June lows at $67 in play after that.
Canadian Dollar Technical Analysis – USD/CAD Daily Chart
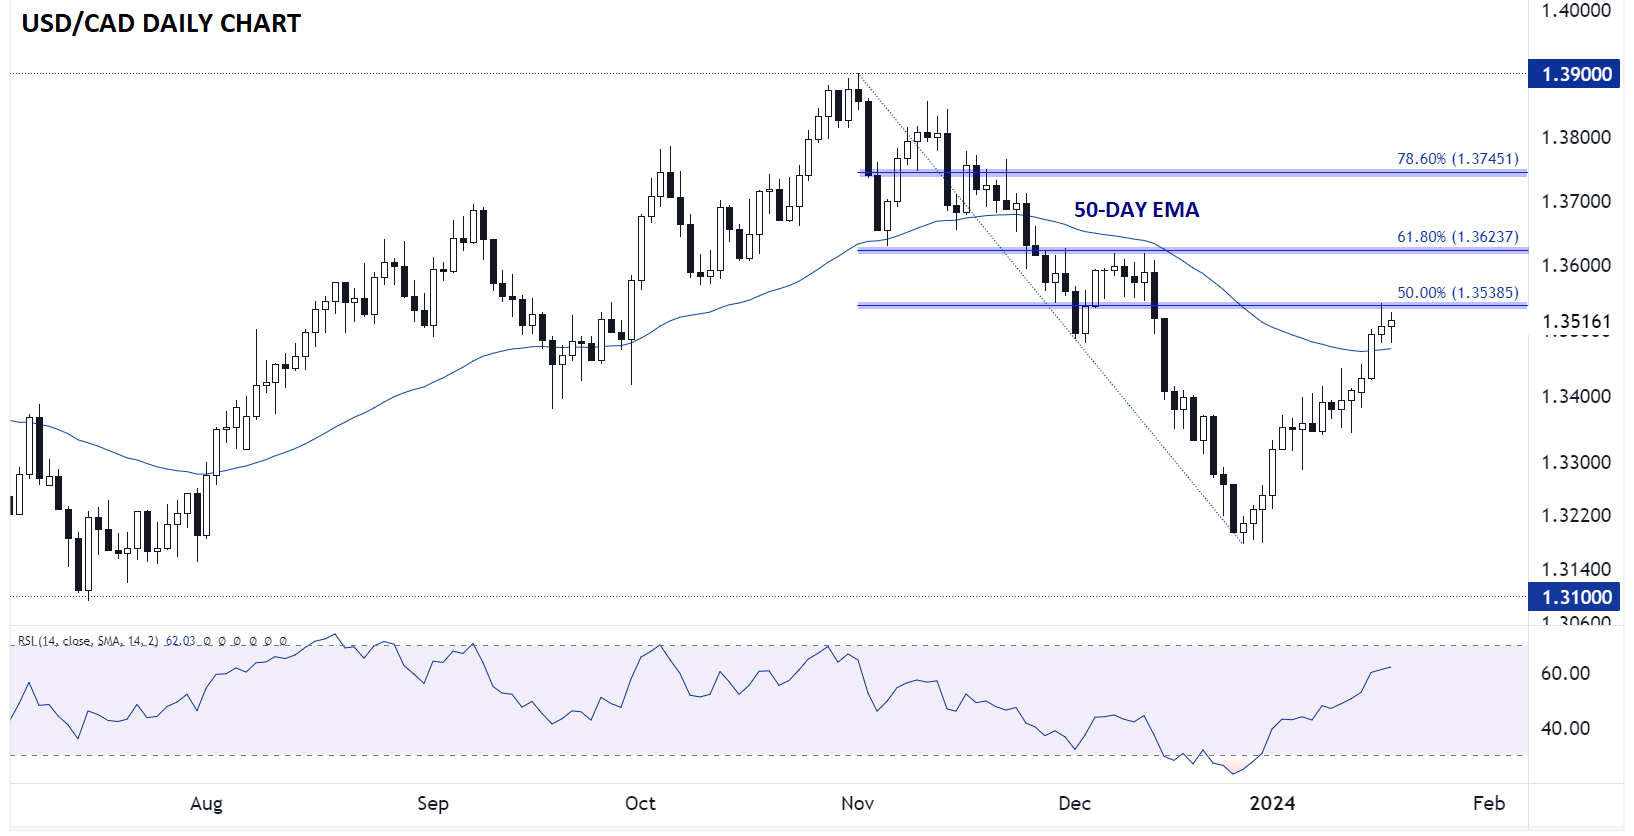
Source: TradingView, StoneX
The Canadian Dollar has historically had a relatively strong correlation with oil prices, but when analyzing USD/CAD, that correlation has been far less consistent in recent years. From a fundamental economic perspective, the weakening correlation likely stems from the emergence of the US as an oil-drilling powerhouse, meaning both sides of the currency pair have large exposures to fluctuations in the price of oil.
In any event, today’s rally in crude oil may be contributing to the pause in USD/CAD’s rally, as is the 50% Fibonacci retracement of the November-December drop at 1.3540. That said, with only three relatively small down days in the pair so far this year, the short-term momentum remains on the side of the bulls, and a break above 1.3540 resistance could target the next Fibonacci retracements at 1.3625 (61.8%) and 1.3745 (78.6%) next.
-- Written by Matt Weller, Global Head of Research
Follow Matt on Twitter: @MWellerFX
Latest market news
Today 07:49 AM
Yesterday 01:39 PM
Latest WTI articles

Yesterday 04:02 AM
April 28, 2024 02:00 PM

April 22, 2024 10:48 PM

April 22, 2024 04:00 PM